Letter of Transmittal
Re: Halstead Jet Center. Opinion of fair market value, one hundred percent of the invested capital.
Dear Mr. Renkirk,
At your request we have valued the fixed base operation your company conducts at Halstead Regional Airport. The purpose of the assignment is to support a negotiated sale of the business, and you, your fellow members, and your counsel are the intended users.
The subject is a full service FBO with seven revenue streams. It sells Jet A and avgas, leases 62,000 square feet of hangar space, handles transient aircraft, operates a Part 145 repair station, and runs a flight school. It occupies 9.03 acres under an operating agreement running from May 1, 2009 to April 30, 2039, leaving 13.0 years from the effective date. The improvements revert to the sponsor at expiration without compensation, and the two five year renewal options are at the sponsor's discretion.
We separated the seven revenue streams, tested each against its own direct cost, and allocated overhead on an avoidable cost basis. That produced two components with different risk: a real property component carrying 61.7 percent of normalized earnings and a service component carrying the rest. We discounted each at its own rate, terminated both at expiration with no terminal value, and cross checked the result against a guideline multiple adjusted for the remaining term. Our opinion of the fair market value of one hundred percent of the invested capital as of April 30, 2026 is:
The multiple is low against what FBO owners hear quoted, and Section 20 explains why. It is the arithmetic of an earnings stream that stops in thirteen years rather than a judgment about the operation, and Section 22 prices what securing the renewal options is worth. The opinion covers the operating company's invested capital. The sponsor holds the other side of the agreement, which we quantify in Section 24. Reasonable exposure time is 9 to 18 months. This report is a sample and is not an opinion of value for any real business.
Respectfully submitted,
VALUATION TAKES FLIGHT LLC
Dr. Carter, DBA, CFA, FRM, CAIA, CIPM
Signature omitted. This is a sample report.
This report follows the Valuation Takes Flight hangar appraisal framework, extended to a going concern. The framework treats a leasehold on an obligated airport as a wasting interest, breaks the asset into components that depreciate at different rates, and refuses to plug any number that can be extracted from evidence. What changes for an FBO is that part of the earnings belong to real estate and part belong to an operating business, and the two do not carry the same risk.
1. Summary of Salient Facts and Conclusions
Exhibit 1. Salient facts
| Item | Detail |
|---|---|
| Subject business | Halstead Jet Center, a full service fixed base operation |
| Location | Halstead Regional Airport, a general aviation reliever with a part time control tower |
| Premises | 9.03 acres (393,400 square feet) under an airport operating agreement |
| Improvements | Three hangars totaling 62,000 leasable square feet, a 9,400 square foot terminal, 268,100 square feet of apron, and a 52,000 gallon fuel farm |
| Operating agreement | Commenced May 1, 2009. Thirty year term. Expires April 30, 2039 |
| Remaining term | 13.0 years from the effective date |
| Renewal | Two five year options at the sponsor's discretion. The first is conditioned on a $1,500,000 capital investment during the preceding term |
| Reversion | Improvements revert to the sponsor at expiration without compensation |
| Ground rent | $165,228 per year, $0.42 per square foot, adjusted every third year by consumer price index with a two percent floor and a four percent ceiling |
| Fuel flowage fee | $0.14 per gallon on all uplift, payable to the sponsor |
| Percentage rent | 2.0 percent of gross revenue above a $6,500,000 breakpoint |
| Annual fuel uplift | 620,000 gallons of Jet A and 74,000 gallons of avgas |
| Revenue | $7,348,010 |
| Normalized EBITDA | $880,786, being 12.0 percent of revenue |
| Interest valued | One hundred percent of the invested capital, controlling and marketable |
| Standard of value | Fair market value |
| Premise of value | Going concern |
| Effective date | April 30, 2026 |
| Report date | May 22, 2026 |
| Intended use | To support a negotiated sale of the business |
| Intended users | The members of Halstead Jet Center LLC and their counsel |
Exhibit 2. Value indications and conclusion
| Approach | Indication | Per gallon | Multiple of EBITDA | Weight |
|---|---|---|---|---|
| Discounted cash flow, 13 years, no terminal value | $3,070,262 | $4.42 | 3.49x | 50 percent |
| Sum of the component values | $3,067,377 | $4.42 | 3.48x | 25 percent |
| Guideline transactions, term adjusted | $3,210,379 | $4.63 | 3.64x | 25 percent |
| Weighted indication | $3,104,570 | $4.47 | 3.52x | |
| Concluded, rounded | $3,100,000 | $4.47 | 3.52x |
The three indications fall within 4.7 percent of one another. That agreement is not an accident of weighting. Each approach starts from the same normalized earnings, the same thirteen year horizon, and the same absence of a terminal value, so the only thing being tested across the three is whether the discount rate, the component split, and the guideline multiple tell a consistent story. They do.
2. Scope of the Assignment
Purpose, intended use, and intended users
The purpose of this assignment is to develop an opinion of the fair market value of one hundred percent of the invested capital of Halstead Jet Center LLC. The intended use is to support a negotiated sale of the business. The intended users are the members of the company and their counsel. No other party is an intended user, and this report is not written for a lender, a taxing authority, a trustee, or a court.
Standard and premise of value
The standard of value is fair market value: the price at which the business would change hands between a willing buyer and a willing seller, neither being under compulsion and both having reasonable knowledge of the relevant facts. The premise is going concern. We assume the buyer continues the operation in place, obtains the sponsor's consent to the transfer, and holds the certificates and permits the operation requires.
What is valued and what is not
We value the invested capital of the operating company, which is the sum of the interest bearing debt and the equity. That is the customary basis for an FBO because the capital structure of a closely held operator is a financing choice rather than an attribute of the business. Equity value at any given transaction date is the invested capital less the debt assumed or retired at closing. We do not opine on equity value here because the debt balance at closing is not known.
The opinion includes the leasehold improvements, the tangible personal property used in the operation, the net working capital, and whatever intangible position survives the remaining term of the operating agreement. It does not include the members' personal assets, the company aircraft that is not used in the operation, or any real property held outside the leasehold.
Scope of work performed
| Procedure | Performed |
|---|---|
| Site inspection | Yes. Interior and exterior of all three hangars, the terminal, the apron, the fuel farm, and the maintenance shop, on March 24 and 25, 2026 |
| Management interviews | Yes. The managing member, the general manager, the line supervisor, and the director of maintenance |
| Financial statement review | Yes. Reviewed financial statements for the five years ended December 31, 2025 and interim statements through March 31, 2026 |
| Fuel system data | Yes. Transaction level export from the fuel management system for the 36 months ended March 31, 2026, reconciled to the general ledger |
| Hangar rent roll | Yes. Tenant by tenant, with lease commencement, expiration, rate, and square footage, reconciled to billings |
| Operating agreement review | Yes. The agreement, all four amendments, the sponsor's minimum standards, and the current rates and charges schedule |
| Airport records | Yes. The airport layout plan, based aircraft counts, operations counts, and capital improvement program |
| Guideline transaction search | Yes. Published FBO transaction evidence and the market approach literature described in Section 18 |
| Environmental assessment | No. See Section 3 |
| Audit of the financial statements | No. We relied on management prepared and reviewed statements |
| Real property appraisal of the improvements | No. The real property component is valued as part of the going concern, not as a separate appraisal |
| Machinery and equipment appraisal | No. Tangible personal property is stated at fair value in continued use based on management's schedule, our inspection, and published used equipment data |
Reporting standards
This is a sample. It is written in the form of a detailed report and follows the structure we use in engagements of this type. It should not be treated as a report prepared under any professional standard, and no party should rely on it for any purpose.
3. Assumptions and Limiting Conditions
General assumptions
- We assume the operating agreement, the amendments, and the rent roll furnished to us are complete and accurate. We read them but we are not attorneys and we offer no legal interpretation of them.
- We assume the company holds good title to the leasehold and to the personal property, free of liens other than those disclosed.
- We assume the Part 145 repair station certificate remains in force and that the buyer obtains its own certificate or completes a change of ownership acceptable to the Federal Aviation Administration. Certificates are not transferable as property.
- We assume the sponsor consents to a transfer on the terms in the agreement and does not impose conditions beyond the current minimum standards.
- We assume the improvements are structurally sound and free of material defect. We are not engineers and we performed no destructive testing.
- Financial information was prepared by management and reviewed by the company's accountants. We did not audit it. Our normalization adjustments are described in Section 13 and are our own.
- We assume the fuel supply agreement and the branding agreement renew on terms no worse than the current terms.
- Projections in this report are not forecasts. They are the cash flows a buyer would model at the effective date on the information then available.
Extraordinary assumption regarding environmental condition
We assume the premises are free of hazardous material and that no remediation obligation attaches to the company. We performed no environmental assessment. This is an extraordinary assumption, and its use might have affected the conclusion. Two conditions warrant particular attention in diligence. The first is the fuel farm. The tanks and canopy date to 2015, but fuel has been dispensed from that corner of the field since the 1970s, which creates an ordinary risk of historical release. The second is per and polyfluoroalkyl substances. Hangar A carries an aqueous film forming foam suppression system, and those agents are the principal source of the compound in a hangar setting. Halstead Regional is not certificated under 14 CFR Part 139 and therefore has never been required to maintain aircraft rescue and firefighting foam, which limits but does not eliminate the exposure. A Phase I environmental site assessment with a foam specific scope should precede any transaction.
Hypothetical conditions
None were used.
Limiting conditions
- This report is a sample. The business, the airport, the parties, and every figure in it are illustrative. Nothing in it is an opinion of value for any real business, and no party should rely on it for any transaction, filing, dispute, or lending decision.
- Possession of this report does not carry the right to publish it. Neither this report nor any part of it may be distributed, quoted, or referred to without our written consent.
- The value opinion applies only as of the effective date and only for the intended use.
- We are not required to give testimony or attend any proceeding regarding this sample.
- Nothing in this report is legal, tax, or investment advice.
A sample report cannot be relied upon and does not attempt to be reliable. What it can do is show a prospective client exactly what the finished work looks like, which questions get asked, and which numbers get supported instead of asserted. Every schedule in this document comes out of one model, so they all move together when an assumption changes.
4. How We Value Fixed Base Operators
An FBO is two businesses in one set of books. Part of it is real estate. Hangar rent, tiedown fees, and ramp charges are rent by another name, and they behave like rent: they are contractual, they are stable, they turn over slowly, and they carry a real estate risk profile. The other part is an operating business. Fuel, handling, maintenance, and training are sold day by day, they carry inventory and receivable risk, they depend on labor the company must recruit and keep, and their margins move with things nobody at the FBO controls.
Valuing the whole of it at one multiple, or at one discount rate, produces a wrong answer in a predictable direction. If the rate is a business rate, the real estate earnings are overcharged for risk and the value comes in low. If the rate is a real estate rate, the service earnings are undercharged and the value comes in high. Section 20 quantifies both errors on this subject.
The seven rules we apply
1. Separate the revenue streams before doing anything else
Every stream gets its own volume driver, its own price, its own direct cost, and its own growth rate. A consolidated income statement hides the fact that 82 percent of the gross margin comes from three of the seven lines.
2. Treat fuel as a margin business, not a revenue business
Gallons and margin per gallon are the two numbers that matter. Retail price is an intermediate step. Nearly half of the subject's revenue disappears the moment fuel cost and the flowage fee are netted, and the remainder is what a buyer is actually purchasing.
3. Treat hangar income as real estate until proven otherwise
Hangar and tiedown income carries a landlord's risk, not an operator's. It gets a real property discount rate and a real property growth rate, and the costs charged against it are the costs a landlord would actually bear.
4. Allocate overhead on an avoidable cost basis and disclose the alternatives
The segment split moves by a factor of two depending on the convention chosen. Section 14 shows three conventions side by side so the reader can see the sensitivity rather than inherit ours.
5. Terminate the projection at expiration and assign no terminal value
Where improvements revert without compensation, there is nothing to sell at the end. The terminal value is zero. That single assumption accounts for most of the distance between the multiple this report concludes and the multiples FBO owners hear quoted.
6. Do not charge the finite term twice
Because the cash flow model already stops at expiration, the company specific risk premium excludes the risk that the agreement ends. Loading it into the discount rate as well would price the same risk in two places.
7. Adjust the guideline multiple rather than the earnings
Published FBO multiples come from operators with long agreements. The term adjustment is the ratio of the present value annuity factor over the remaining term to the factor over a perpetual horizon. The factor falls out of the two rates and the term, and there is nothing to argue about in it.
Earnings that run out in thirteen years are not worth a perpetuity multiple. Everything else in this report is bookkeeping around that one sentence.
5. The Federal Overlay: What the Sponsor Can and Cannot Do
Halstead Regional has accepted federal airport improvement grants. That makes it an obligated airport, and it puts a body of federal law between the sponsor and the operator that a buyer must understand before pricing anything. The rules do not set rates. What they do is fix the boundaries inside which the sponsor may act, and several of those boundaries have direct value consequences.
Exhibit 3. Federal authorities bearing on the subject
| Authority | What it establishes | Why it matters here |
|---|---|---|
| FAA Order 5190.6C, effective February 20, 2026, cancelling Order 5190.6B | The Airport Compliance Manual. Twenty three chapters governing how a sponsor administers its federal obligations | The current text of every rule below. A buyer diligencing an FBO in 2026 should be reading 5190.6C and not the prior edition |
| Order 5190.6C, chapter 8, Exclusive Rights | An exclusive right is a power or privilege excluding another from exercising a like right. It may be conferred by express agreement, by unreasonable standards, or by other means | No lawful exclusivity attaches to the subject's position. Any premium a buyer assigns to being one of only two operators is unsupportable |
| Order 5190.6C, section 8.5 and section 8.6 | A single provider is not itself a violation. A sponsor may decline a second provider only where both conditions hold: more than one entity would be unreasonably costly, burdensome, or impractical, and accommodation would require reducing space already in aeronautical use | The two part test is conjunctive. Sponsors rarely document both parts, and a buyer should not assume the field is closed to a third operator |
| Order 5190.6C, chapter 10, Reasonable Commercial Minimum Standards | Standards must be reasonable, not unjustly discriminatory, attainable, uniformly applied, and relevant to the activity | The renewal options are conditioned on compliance with then current standards. Standards that tighten during the term raise the cost of exercising the option |
| Order 5190.6C, section 10.5 | A sponsor should not, without adequate justification, require a single service provider to meet full service FBO criteria, and should not adopt standards copied from another airport | Constrains the sponsor from using minimum standards to protect the incumbent. It cuts against the subject as often as for it |
| Order 5190.6C, chapter 11, and Grant Assurance 22(f) | A based aircraft owner may perform its own fueling, ground handling, servicing, and maintenance with its own employees. The sponsor may impose reasonable safety rules and may charge the same flowage fee it charges commercial sellers | The largest identified threat to fuel margin. Section 11 quantifies it |
| Order 5190.6C, chapter 17, Self Sustainability, and Grant Assurance 24 | The sponsor must maintain a fee and rental structure that makes the airport as self sustaining as possible in its circumstances | Pushes ground rent toward market at every reset and at renewal. Section 22 models a reset |
| FAA Advisory Circular 150/5190-8, December 7, 2023, cancelling AC 150/5190-7 | Current guidance on minimum standards for commercial aeronautical activities. Self fueling and other self services cannot be contracted out to a third party | Limits the self fueling exposure to genuine in house programs, which is the assumption behind the gallons modeled in Section 11 |
| Grant Assurance 22, Economic Nondiscrimination, and Grant Assurance 23, Exclusive Rights | The sponsor must make the airport available on reasonable terms without unjust discrimination and may not grant an exclusive right | The legal basis for chapters 8 through 11 of the order |
| 81 FR 38906, June 15, 2016 | Federal policy on non aeronautical use of federally obligated hangars | Governs what the subject's hangar tenants may store and do. Enforcement risk sits with the landlord as well as the tenant |
The three consequences that reach the number
Exclusivity is not for sale. Buyers of FBOs sometimes pay for the belief that the airport will not admit a competitor. At an obligated airport that belief has no legal support unless the sponsor has documented both parts of the section 8.6 test, and the subject's sponsor has not. We assigned no premium for the current two operator structure. What we did assign is the barrier quantified in Section 19, which is economic rather than legal: a new entrant must build.
Self fueling is a right, not a concession. A based operator may fuel its own aircraft with its own employees and owes only the flowage fee. Three of the subject's based turbine operators are large enough for a self fueling program to pay for itself. Section 11 prices what that would cost.
Self sustainability points the ground rent one way. Contract ground rent of $0.42 per square foot sits below our concluded market rent of $0.51. The gap is an asset today, quantified in Section 23. It is also the reason the sponsor has an obligation to close it at renewal, which is why the renewal scenarios in Section 22 carry a rent reset rather than a rollover.
None of these authorities sets a price. They set the range of outcomes the sponsor may lawfully impose, and a valuation that ignores them prices a business that could not exist. The practical test is simple: for every dollar of margin in the model, ask which federal rule permits the sponsor or a competitor to take it away, and whether they would.
6. Halstead Regional Airport and the Market
Halstead Regional is a general aviation reliever serving a metropolitan area 34 minutes away by road. It has a 6,100 foot primary runway, a Category I instrument landing system, and a Class D tower staffed from 0600 to 2200. Two fixed base operators serve the field. The subject is the larger of the two and holds the only Part 145 repair station on the airport.
Exhibit 4. Airport profile
| Characteristic | Detail |
|---|---|
| Primary runway | 15/33, 6,100 feet by 100 feet, grooved concrete, pavement condition index 79 |
| Secondary runway | 6/24, 3,850 feet by 75 feet, asphalt, no instrument approach |
| Approaches | Category I instrument landing system to Runway 33. Area navigation with localizer performance and vertical guidance to both ends of 15/33 |
| Control tower | Class D, staffed 0600 to 2200 local |
| Weather | 268 visual flight rules days per year |
| Based aircraft | 214, of which 38 are turbine |
| Annual operations | 61,400 |
| Fixed base operators | Two. The subject and one competitor at the south end of the field |
| Repair stations | One, held by the subject |
| United States customs | Not on the field. Nearest port of entry is 41 minutes by air |
| Part 139 certification | No |
| Hangar demand | A 14 month waiting list for enclosed corporate storage across both operators |
| Drive time | 34 minutes to the central business district |
Scoring the airport
We score airports on the Valuation Takes Flight Airport Value Index because the alternative, which is to describe an airport in adjectives, does not produce a rent conclusion anyone can check. The index weights operational factors at 40 percent, service factors at 30 percent, and market factors at 30 percent. It classifies a score of 80 to 100 as Class A, a premier destination; 60 to 79 as Class B, a strong regional; 40 to 59 as Class C, a secondary market; 20 to 39 as Class D, limited service; and below 20 as below investment grade. It anchors to two observed rent points: the midpoint of the published Class A band at $21.50 per square foot and the midpoint of the Class C band at $7.50.
Exhibit 5. Airport Value Index, component scoring
| Factor | Score |
|---|---|
| Operational factors, weighted 40 percent | 80 |
| Primary runway, 6,100 feet by 100 feet, grooved | 88 |
| Instrument approach capability, Category I and LPV both ends | 84 |
| Air traffic control tower, Class D, 0600 to 2200 | 74 |
| Pavement condition index 79, full length parallel taxiway | 82 |
| Weather, 268 visual flight rules days | 72 |
| Service factors, weighted 30 percent | 70 |
| Competing service providers on the field | 68 |
| United States customs, nearest port of entry 41 minutes | 46 |
| Part 145 repair station on the field | 80 |
| Avionics and interior capability | 72 |
| Crew and passenger amenities | 84 |
| Market factors, weighted 30 percent | 76 |
| Based aircraft 214, of which 38 turbine | 78 |
| Annual operations 61,400 | 74 |
| Drive time to the central business district, 34 minutes | 72 |
| Regional corporate base and household income | 76 |
| Hangar demand, 14 month waiting list | 80 |
| Composite Airport Value Index score | 75.8 |
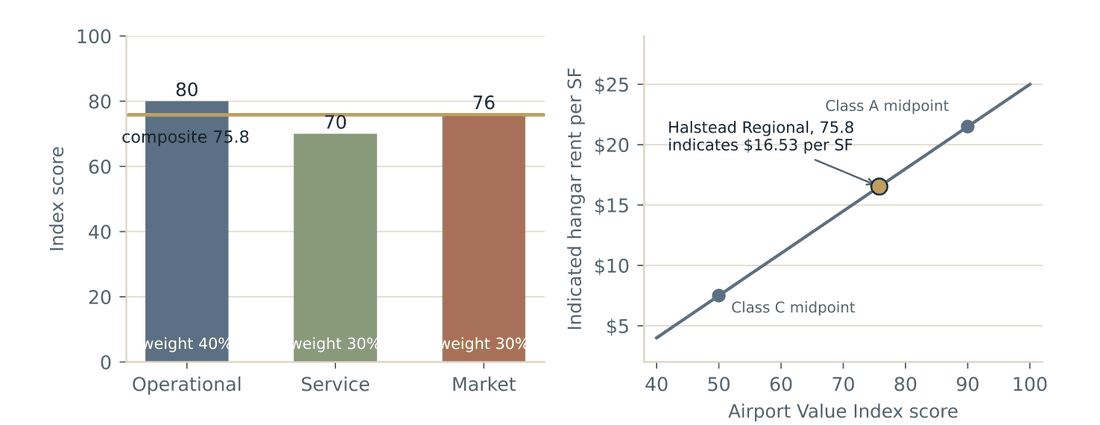
A composite of 75.8 places Halstead Regional at the upper end of the Class B band and four points short of Class A. Interpolating between the two anchors at $0.35 per index point gives an indicated hangar rent of $16.53 per square foot. Our rent survey of the two operators on the field and of four comparable airports concluded $16.50. The two agree within three cents, which is closer than the method deserves credit for and closer than we would represent as repeatable. What it does establish is that the subject's rent is not an outlier.
What the score does not capture
Two conditions matter to this business and do not appear in the index. The first is that the nearest United States port of entry is 41 minutes away, which removes international arrivals from the addressable market and takes with them the handling fees and the fuel uplift that accompany them. The second is the mechanic labor market. The repair station has carried two unfilled airframe and powerplant positions for eleven months, and that constraint is the reason the maintenance growth rate in Section 16 is held at 3.4 percent rather than at the rate the order backlog would support.
7. The Operating Agreement
The operating agreement is the single most important document in this valuation. It fixes how long the earnings run, what the operator pays for them, what the operator must do to keep them, and what happens to everything the operator built when the term ends.
Exhibit 7. Terms of the operating agreement
| Provision | Term | Valuation consequence |
|---|---|---|
| Commencement | May 1, 2009 | Seventeen of the thirty years are gone |
| Expiration | April 30, 2039 | 13.0 years remain at the effective date |
| Ground rent | $0.42 per square foot on 393,400 square feet, $165,228 per year | Below the $0.51 market rate concluded in Section 23. The gap is a favorable lease intangible |
| Rent adjustment | Every third year by consumer price index, floor two percent, ceiling four percent | Modeled at 2.5 percent per year. The ceiling caps the sponsor's upside and is worth having |
| Fuel flowage fee | $0.14 per gallon on all uplift | A variable cost of selling fuel. It is charged against fuel margin, not against overhead |
| Percentage rent | 2.0 percent of gross revenue above $6,500,000 | The breakpoint is fixed in dollars, so the sponsor's share grows faster than revenue |
| Renewal options | Two five year options, each at the sponsor's sole discretion | Options at the sponsor's discretion are not options in the financial sense. They are hopes with a probability attached, which is how Section 22 treats them |
| Capital condition on the first option | $1,500,000 invested during the preceding term | The operator must spend before knowing whether the sponsor will grant. Section 22 prices that |
| Compliance condition | Compliance with then current minimum standards at the time of renewal | A standard adopted in year eleven can raise the cost of an option exercised in year thirteen |
| Reversion | Improvements revert to the sponsor at expiration without compensation | Terminal value is zero. This is the assumption that drives the conclusion |
| Surrender | Premises returned in good condition, ordinary wear excepted | A liability, not a neutral event. Estimated at $340,000 and present valued in Section 16 |
| Transfer | Sponsor consent required, not to be unreasonably withheld | Consent risk is a diligence item, not a discount. See Section 27 |
| Exclusivity | None granted | Consistent with Grant Assurance 23. No premium assigned |
| Leasehold mortgage | Permitted with sponsor consent, thirty day cure period to the lender | The cure period is short. It narrows the pool of lenders and is one reason the mortgage weight in Exhibit 26 is held at 55 percent |
Seventeen years into a thirty year agreement, the operator has already made most of the investment and has thirteen years to recover the rest. That is the position every seller of a mature FBO is in, and it is the reason the going in yield on this business is so much higher than the yield on a comparable business with a long agreement. Section 20 puts a number on the difference.
8. The Premises, the Improvements, and the Equipment
The leased premises are 9.03 acres on the west side of the field, with 700 feet of taxilane frontage and 562 feet of depth. Everything the operation uses sits inside that rectangle except the taxilane itself, which is airport pavement.
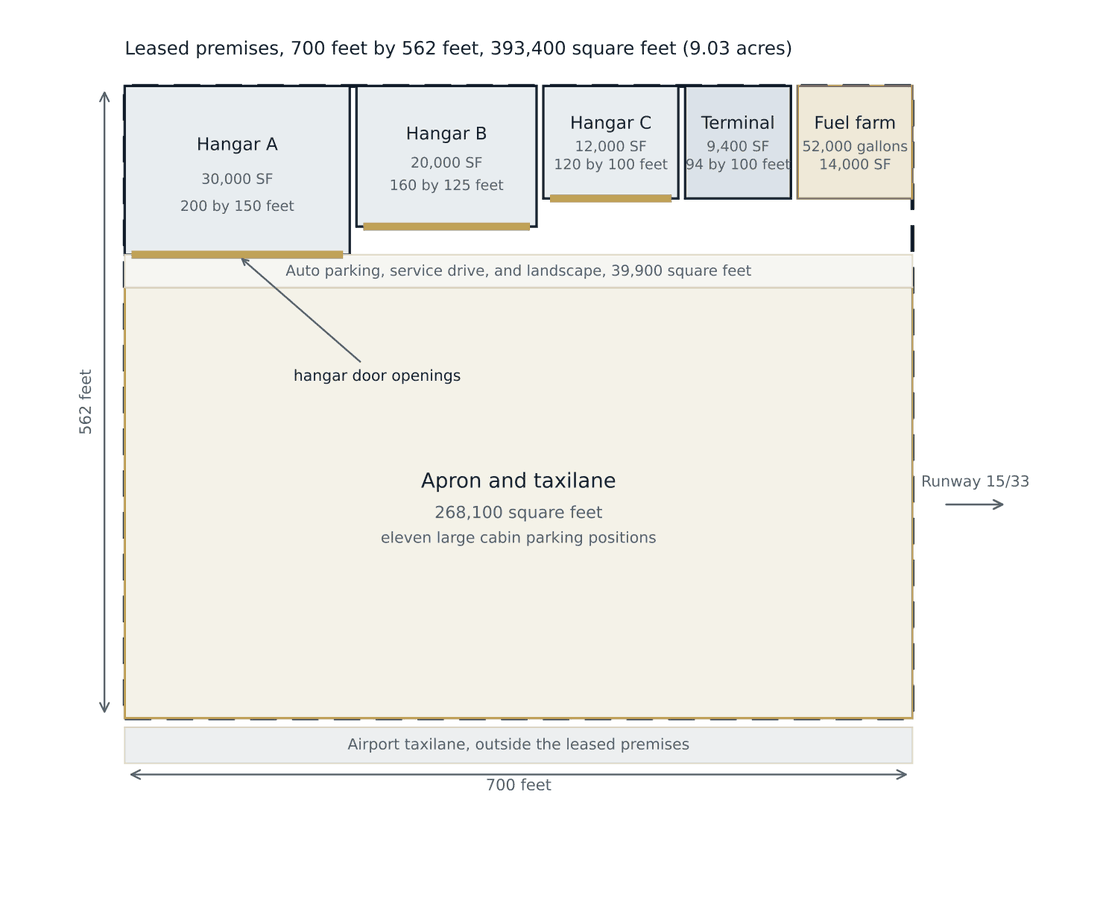
Exhibit 9. Improvement schedule
| Improvement | Built | Size | Description |
|---|---|---|---|
| Hangar A | 2009 | 30,000 SF | 200 by 150 feet, 32 foot clear height, two bays, aqueous film forming foam suppression, two bi-fold door systems each 96 feet by 30 feet |
| Hangar B | 2009 | 20,000 SF | 160 by 125 feet, 28 foot clear height, two bays, wet pipe suppression, two bi-fold door systems each 76 feet by 26 feet |
| Hangar C | 2011 | 12,000 SF | 120 by 100 feet, 24 foot clear height, one bay, wet pipe suppression, one bi-fold door system 96 feet by 22 feet |
| Terminal | 2010 | 9,400 SF | Lobby, three conference rooms, crew lounge with quiet room, flight planning, dispatch, administrative offices, and the flight school classroom |
| Apron | 2010 | 268,100 SF | Portland cement concrete, eleven marked large cabin positions, perimeter drainage, sixteen light poles |
| Fuel farm | 2015 | 14,000 SF | Two 20,000 gallon Jet A tanks and one 12,000 gallon avgas tank, above ground, secondary containment, canopy, card reader self serve island for avgas |
| Site improvements | 2010 | 39,900 SF | Auto parking for 62 vehicles, service drive, perimeter fencing, two card controlled vehicle gates, landscape |
Condition and effective age
The buildings are in good condition and have been maintained. Effective ages run at or slightly below chronological ages, which is what we expect where an operator carries a service reputation and the sponsor inspects. Two components run well ahead of the shells that house them. The apron was placed in 2010 and carries an effective age of sixteen years against a twenty five year economic life, and it is scheduled for a mill and overlay in projection year ten. The Hangar A and Hangar B door systems date to 2009 and carry an effective age of seventeen years against a twenty five year life, which makes them the oldest mechanical assets on the premises and is why the Hangar A rebuild sits in projection year three. Section 19 depreciates every component separately for exactly this reason.
Exhibit 10. Tangible personal property at fair value in continued use
| Asset | Fair value |
|---|---|
| Jet A refueler, 5,000 gallon | $185,000 |
| Jet A refueler, 3,000 gallon | $88,000 |
| Avgas refueler, 1,200 gallon | $52,000 |
| Deicing truck, 1,000 gallon | $98,000 |
| Heavy tug | $74,000 |
| Light tugs, two units | $38,000 |
| Ground power, air start, and lavatory service | $61,000 |
| Part 145 shop equipment and tooling | $118,000 |
| Snow removal equipment | $58,000 |
| Vehicles, four units | $58,000 |
| Terminal furnishings, information technology, and fuel management | $71,000 |
| Total tangible personal property | $901,000 |
Tangible personal property is the only part of this business that survives the reversion. The hangars, the terminal, the apron, and the fuel farm all belong to the sponsor on May 1, 2039. The refuelers, the deicer, the tugs, the shop equipment, and the vehicles can be driven onto a trailer. That distinction is why Section 23 carries them at fair value in continued use while it carries the leasehold improvements at contributory value over the remaining term.
9. Highest and Best Use
Highest and best use is tested in three places for a business of this kind: the premises as though vacant, the premises as improved, and the enterprise as a going concern. Only the third test changes anything here.
The premises as though vacant
The premises front an active taxilane inside the airport fence and are encumbered by an operating agreement that limits use to aeronautical activity. The legally permissible uses are those the sponsor's minimum standards allow. The physically possible uses are constrained by the 9.03 acre footprint and by the requirement that any building line hold the taxilane object free area. The financially feasible and maximally productive use is a fixed base operation with enclosed hangar storage, which is what stands there.
The premises as improved
The improvements contribute more than the cost of demolishing them, the layout matches current demand, and the hangar waiting list at both operators establishes that the enclosed storage is not oversupplied. Continuation of the existing use is the highest and best use as improved. No component is a candidate for removal before expiration, and with thirteen years to run, none would earn back a redevelopment.
The enterprise as a going concern
This is where the analysis matters. The relevant comparison is between the business as it operates and two alternatives. The first is an orderly liquidation, in which the operator surrenders the premises, sells the tangible personal property, collects the receivables, and walks. The second is a narrowed operation, in which the operator keeps the hangars and the fuel and exits maintenance and flight training.
Exhibit 11. Highest and best use of the enterprise
| Alternative | Indication | Comment |
|---|---|---|
| Continue as a going concern | $3,100,000 | The concluded value. Every stream contributes positive gross margin, and gross margin covers overhead with $686,586 to spare before normalization and $880,786 after it |
| Orderly liquidation | $595,120 | Tangible personal property at 72 percent of fair value in continued use, plus net working capital, less the surrender obligation. Roughly 19 percent of the going concern value |
| Narrow to fuel and hangar | Not quantified | The two exited streams contribute $581,020 of combined gross margin against direct costs that are largely variable. Exiting them would strand the shop and classroom space and would not reduce overhead proportionately |
Continuation as a going concern is the highest and best use. The liquidation indication is worth stating anyway, because it is the floor a seller should know before negotiating and because it moves in the opposite direction from enterprise value as the term shortens. In year twelve of thirteen, the liquidation number will not have changed much and the going concern number will have collapsed toward it.
10. Separating the Revenue Streams
The company reports one income statement. A buyer prices seven businesses. The first analytical step, and the one most often skipped, is to pull the streams apart and put each one next to its own direct cost.
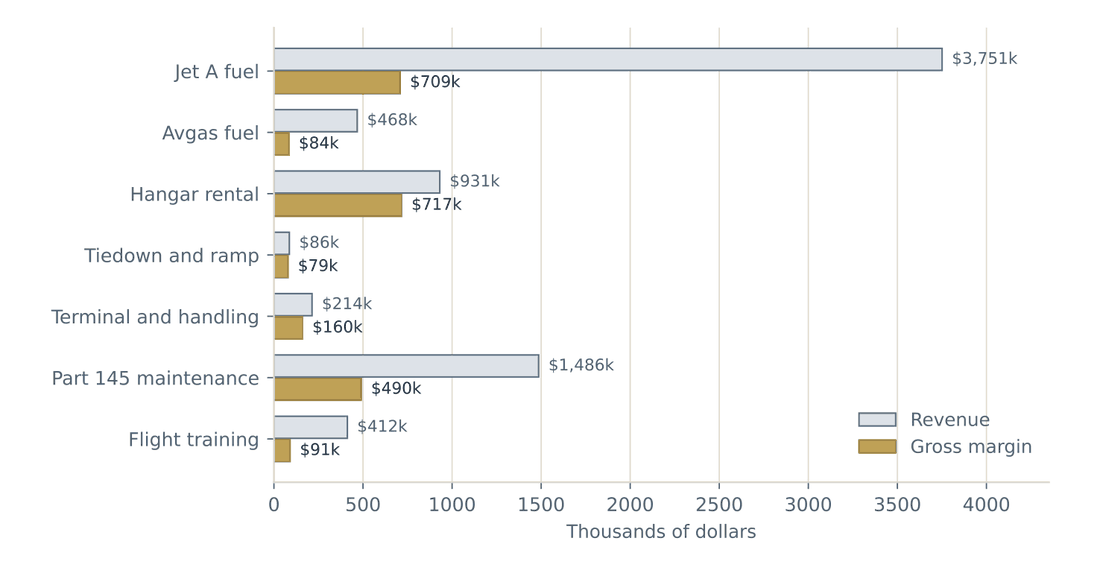
Exhibit 12. Revenue, direct cost, and gross margin by stream Trailing twelve months to March 31, 2026.
| Revenue stream | Revenue | Direct cost | Gross margin | Margin | Share of margin |
|---|---|---|---|---|---|
| Jet A fuel | $3,751,000 | $3,042,464 | $708,536 | 18.9% | 30.4% |
| Avgas fuel | $467,680 | $383,320 | $84,360 | 18.0% | 3.6% |
| Hangar rental | $930,930 | $213,900 | $717,030 | 77.0% | 30.8% |
| Tiedown, ramp, and aircraft parking | $86,400 | $6,912 | $79,488 | 92.0% | 3.4% |
| Terminal, handling, and ancillary services | $214,000 | $53,500 | $160,500 | 75.0% | 6.9% |
| Part 145 maintenance | $1,486,000 | $995,620 | $490,380 | 33.0% | 21.0% |
| Flight training | $412,000 | $321,360 | $90,640 | 22.0% | 3.9% |
| Total | $7,348,010 | $5,017,076 | $2,330,934 | 31.7% | 100.0% |
What the separation shows
Jet A produces $3,751,000 of revenue and $708,536 of gross margin. It is 51 percent of the top line and 30 percent of the money. Hangar rental produces less than a quarter of the Jet A revenue and slightly more gross margin. Part 145 maintenance produces $1,486,000 of revenue and $490,380 of margin, a 33 percent conversion that reflects a labor business in a tight mechanic market.
Three of the seven streams carry 82 percent of the gross margin: Jet A, hangar rental, and the repair station. A buyer's diligence budget should follow that concentration rather than spread evenly across the income statement.
Exhibit 14. Direct cost conventions used above
| Stream | What is charged as direct cost |
|---|---|
| Jet A and avgas | Into plane cost of the fuel delivered plus the $0.14 per gallon flowage fee payable to the sponsor. Line labor is not charged here; it is overhead |
| Hangar rental | Utilities, repairs and maintenance, and property insurance attributable to the hangar bays, at $3.45 per leasable square foot |
| Tiedown, ramp, and parking | Marking, sweeping, and snow removal consumables |
| Terminal, handling, and ancillary | Catering and ground transportation bought for resale, lavatory and potable water service consumables, deicing fluid |
| Part 145 maintenance | Technician wages and benefits, parts at cost, outside services, and shipping |
| Flight training | Instructor pay, aircraft rental or lease cost, fuel consumed in training, and insurance specific to the training fleet |
Gross margin percentages across streams are not comparable and are not meant to be. Fuel converts at 19 percent because the cost of goods is most of the price. Hangar rental converts at 77 percent because there are almost no goods. What makes them comparable is what happens next: each stream is charged the overhead it would actually cause, which is Section 14.
11. Fuel Is a Margin Business
The subject pumped 620,000 gallons of Jet A and 74,000 gallons of avgas in the trailing twelve months. That produced $4,218,680 of revenue and $792,896 of gross margin. The $3,425,784 of revenue in between is the cost of the fuel and the flowage fee, and it belongs to somebody else.
Exhibit 15. Fuel margin build
| Jet A | Avgas | Total | |
|---|---|---|---|
| Gallons | 620,000 | 74,000 | 694,000 |
| Blended retail price per gallon | $6.050 | $6.320 | |
| Into plane cost per gallon | ($4.767) | ($5.040) | |
| Fuel flowage fee per gallon | ($0.140) | ($0.140) | |
| Net margin per gallon | $1.143 | $1.140 | $1.143 |
| Revenue | $3,751,000 | $467,680 | $4,218,680 |
| Cost of fuel and flowage | ($3,042,464) | ($383,320) | ($3,425,784) |
| Gross margin | $708,536 | $84,360 | $792,896 |
| Flowage fee paid to the sponsor | $97,160 |
Where the Jet A margin actually comes from
A blended margin per gallon is an average of three very different transactions. We pulled 36 months of transaction level data out of the fuel management system and sorted every uplift into one of three buckets.
Exhibit 16. Jet A volume and margin by customer type
| Customer type | Share of gallons | Gallons | Margin per gallon | Gross margin | Share of margin |
|---|---|---|---|---|---|
| Transient retail | 34% | 210,800 | $2.10 | $442,680 | 55.7% |
| Contract fuel programs | 46% | 285,200 | $0.78 | $222,456 | 28.0% |
| Based and hangar tenant | 20% | 124,000 | $1.05 | $130,200 | 16.4% |
| Total, before flowage | 100% | 620,000 | $1.2828 | $795,336 | 100.0% |
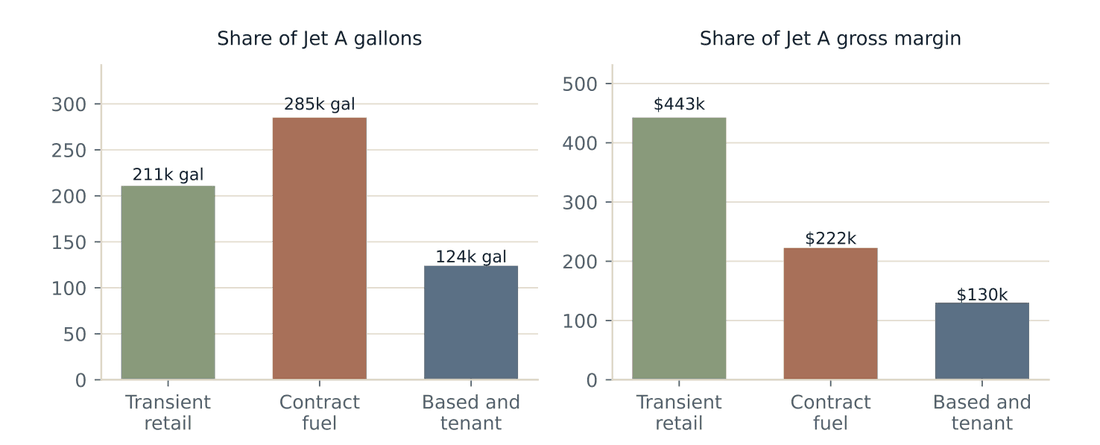
Contract fuel programs take 46 percent of the gallons and return 28 percent of the margin. Transient retail takes 34 percent of the gallons and returns 56 percent. That asymmetry is the central economic fact about a modern FBO fuel desk, and it is the reason volume by itself tells a buyer almost nothing.
Two exposures we priced
Mix migration. The contract fuel share has moved from 39 percent to 46 percent over the 36 months we examined. If it moves another ten points at the expense of transient retail, the blended Jet A margin falls from $1.2828 to $1.1508 per gallon.
Self fueling. Grant Assurance 22(f) and chapter 11 of Order 5190.6C give a based operator the right to fuel its own aircraft with its own employees. The sponsor cannot prohibit it and the self fueler pays only the flowage fee. Three of the subject's based turbine operators uplift enough Jet A for an in house program to pay for its own truck and training. Advisory Circular 150/5190-8 provides that self fueling cannot be contracted out to a third party, which is what keeps this exposure bounded: the operator has to run the program itself.
Exhibit 18. Two priced exposures to fuel margin
| Exposure | Annual gross margin at risk | Share of normalized EBITDA | Present value of the after tax loss over the remaining term |
|---|---|---|---|
| Ten point migration from transient retail to contract fuel programs | $81,840 | 9.3 percent | $411,598 |
| Self fueling by the three largest based turbine operators, 92,000 gallons at $0.91 per gallon, being the $1.05 tenant margin net of the flowage fee the operator stops paying | $83,720 | 9.5 percent | $421,053 |
The self fueling figure is 13.6 percent of the concluded value. We did not deduct it, because there is no evidence any of the three operators has begun the process, and a valuation is not a stress test. We disclose it because a buyer who has not asked those three tenants about their fueling plans has not finished diligence.
What we assumed about growth
Gallons are held flat for Jet A and are declined at 1.5 percent per year for avgas. That is a deliberate choice. The Aviation Business Strategies Group annual fuel sales survey published in March 2024 reported that 41 percent of responding fixed base operators sold less fuel in 2023 than in 2022, against 29 percent the year before, and the piston fleet that consumes avgas continues to shrink. Growth in the fuel line comes entirely from margin per gallon, modeled at 2.2 percent per year, and that assumption is the single largest driver of the value conclusion. Section 21 shows how much.
Sellers describe their FBO in gallons. Buyers pay for margin. One hundred thousand additional gallons sold through contract programs would add $64,000 of gross margin. Twenty cents a gallon across the book the subject already has would add $138,800. The second is 2.2 times the first and does not require a single additional aircraft.
12. Hangar, Ramp, and the Rest of the Book
Hangar rental is the second largest gross margin line and the most stable one. It is also the line most often mispriced, because it appears on an FBO income statement and therefore gets valued as though it were an operating business.
Exhibit 19. Hangar and ramp
| Item | Detail |
|---|---|
| Leasable hangar area | 62,000 square feet across three buildings |
| Contract rent | $16.50 per square foot per year, gross |
| Occupancy | 91 percent, being the three year average |
| Hangar revenue | $930,930 |
| Tenant count | 31, of which 6 are turbine operators |
| Largest tenant | 9.4 percent of hangar revenue, on a lease expiring in 2029 |
| Weighted average remaining lease term | 2.8 years |
| Waiting list | 14 months for enclosed corporate storage |
| Tiedown and ramp positions | 28 marked tiedowns and eleven large cabin apron positions |
| Tiedown, ramp, and parking revenue | $86,400 |
| Rent escalation modeled | 3.0 percent per year |
Why this is real estate
Hangar income has the attributes that define real estate income. It is contractual rather than transactional. It is collected monthly on written leases. It does not depend on the operator being open at two in the morning. Its cost structure is utilities, roof, doors, insurance, and taxes, which are landlord costs. Its risk is vacancy and credit, which are landlord risks. And its growth is rent growth, which runs with a local market rather than with a national fuel margin.
The counter argument is that FBO hangar tenants receive services a landlord does not provide: towing in and out, after hours access, ramp clearing, and a front desk. That is true, and it is the reason Section 14 charges the hangar segment for the staffing a hangar landlord would still have to carry rather than charging it nothing. It is not a reason to discount hangar income at an operating business rate.
Terminal, handling, and ancillary
This line collects ramp fees, handling, ground power, lavatory and potable water service, deicing, catering commissions, rental car commissions, and after hours callouts. It produced $214,000 of revenue at a 75 percent margin. It is the most closely correlated line to transient fuel volume, because most of it is billed to the same aircraft on the same visit. We modeled it at 2.6 percent growth, which matches the transient traffic assumption rather than the fuel margin assumption.
Part 145 maintenance
The repair station holds airframe and limited powerplant ratings and employs seven technicians against nine authorized positions. It produced $1,486,000 of revenue at a 33 percent gross margin, which is consistent with a labor business that bills parts near cost. Two constraints bound it. The first is the two unfilled positions, which have persisted for eleven months. The second is shop space: the maintenance bay occupies part of Hangar B and cannot expand without displacing a paying tenant. Growth is modeled at 3.4 percent.
A note on how maintenance businesses get valued. Published guidance benchmarks maintenance and repair operations near one times revenue, with specialized and high margin shops such as avionics toward the top of the earnings multiple range. One times revenue would price this repair station at $1,486,000, which is 48 percent of the concluded value of the whole enterprise for a segment producing 21 percent of the gross margin. Rules of thumb do not survive contact with a finite term.
Flight training
The flight school operates four aircraft, three owned and one on leaseback, and employs five instructors. It produced $412,000 of revenue at a 22 percent margin, which is the lowest conversion in the book. It is retained in the model because it feeds the avgas line, fills tiedown positions, and is the recruiting channel for line staff. It contributes $90,640 of gross margin, which is 4 percent of the total, and no buyer should pay much for it.
13. Normalizing Earnings
Reported earnings of a closely held FBO reflect the owner's tax planning, the owner's lifestyle, and whatever happened that year. Normalization restates them as the earnings a buyer would inherit. Every adjustment below is supported by a document, not by an assertion.
Exhibit 20. Overhead, as reported
| Overhead item | Amount | Percent of revenue |
|---|---|---|
| Salaries and wages | $684,000 | 9.31% |
| Payroll taxes and employee benefits | $164,160 | 2.23% |
| Ground rent payable to the sponsor | $165,228 | 2.25% |
| Percentage rent payable to the sponsor | $16,960 | 0.23% |
| Property and general liability insurance | $118,400 | 1.61% |
| Utilities not charged to a revenue line | $96,300 | 1.31% |
| Facilities repairs and maintenance | $74,600 | 1.02% |
| Vehicle and ground support equipment operating | $58,900 | 0.80% |
| Marketing, loyalty program, and network fees | $71,400 | 0.97% |
| Professional fees, licenses, and information technology | $63,200 | 0.86% |
| Property taxes on the leasehold and personal property | $84,700 | 1.15% |
| Other administrative | $46,500 | 0.63% |
| Total overhead | $1,644,348 | 22.38% |
Exhibit 21. Normalization of earnings
| Amount | |
|---|---|
| Gross margin, all streams | $2,330,934 |
| Less total overhead | ($1,644,348) |
| EBITDA as reported | $686,586 |
| Owner compensation in excess of market for the role | $142,000 |
| Nonrecurring legal fees, ground lease interpretation | $38,500 |
| Personal vehicle, travel, and club dues | $27,400 |
| Company aircraft not used in the operation | $61,000 |
| Environmental compliance and fuel farm testing, normalized | ($18,900) |
| Insurance premium restated to the renewal quotation | ($24,600) |
| Gain on disposal of ground support equipment | ($31,200) |
| Total normalization adjustments | $194,200 |
| Normalized EBITDA | $880,786 |
Support for each adjustment
| Adjustment | Support |
|---|---|
| Owner compensation in excess of market for the role | The managing member draws $340,000. Compensation survey data and two general manager offers made at comparable operations in the last eighteen months support $198,000 for the role as performed. The excess is added back |
| Nonrecurring legal fees | Counsel invoices relating to a 2024 dispute with the sponsor over the interpretation of the percentage rent breakpoint. The matter is concluded and the fees will not recur |
| Personal vehicle, travel, and club dues | Identified from the general ledger detail and confirmed by management. Not required by the operation |
| Company aircraft not used in the operation | A single engine turboprop titled in the company and used by the managing member. It is not on the flight school line, is not chartered, and is excluded from the assets valued |
| Environmental compliance and fuel farm testing | Reported cost has averaged $9,400 against a compliance schedule that requires $28,300 of annual testing, cathodic protection survey, and containment inspection. Normalized upward, which reduces EBITDA |
| Insurance premium restated to the renewal quotation | The bound renewal effective April 1, 2026 is $24,600 above the trailing twelve month expense. A buyer inherits the higher number |
| Gain on disposal of ground support equipment | A 2025 gain on the sale of two tugs and a lavatory cart. Nonrecurring and removed |
Normalized EBITDA of $880,786 is 12.0 percent of revenue. Three of the seven adjustments move against the seller, which is worth saying out loud: normalization is not a device for making the number larger. The environmental restatement, the insurance restatement, and the removal of the equipment disposal gain reduce EBITDA by $74,700 between them, and a buyer who does not find them will find them in the first year of ownership instead.
A normalization schedule that runs entirely in one direction is a negotiating position rather than an analysis. The test we apply is whether each adjustment would survive being read aloud to the other side of the transaction. All seven above would.
14. Allocating Overhead, and Why the Answer Moves
Gross margin by stream is objective. Segment profitability is not. It depends entirely on how $1,644,348 of overhead is pushed down onto the streams, and the conventions in common use produce answers that differ by a factor of two.
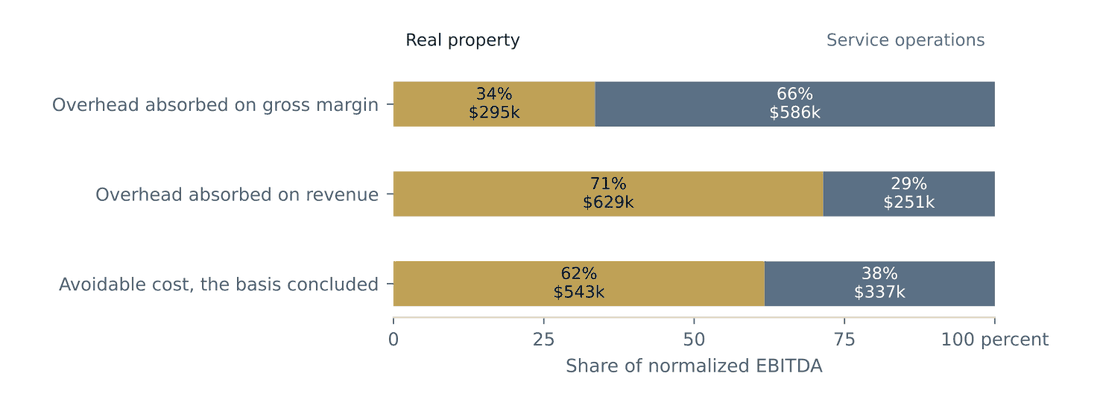
Exhibit 22. Normalized EBITDA by segment under three allocation conventions
| Convention | Real property segment | Service segment | Real property share |
|---|---|---|---|
| Overhead absorbed in proportion to gross margin | $295,088 | $585,698 | 33.5% |
| Overhead absorbed in proportion to revenue | $629,328 | $251,457 | 71.5% |
| Avoidable cost, the basis concluded | $543,355 | $337,431 | 61.7% |
Why we use avoidable cost
Absorbing overhead in proportion to gross margin charges the real property segment for a share of the fuel desk, the dispatch office, and the maintenance shop's supervision. Absorbing it in proportion to revenue does the opposite: because that segment is only 14 percent of revenue but 34 percent of gross margin, revenue based absorption barely charges it anything. Neither answers the question a buyer is asking, which is what the hangar business would cost to run if the rest of the operation went away.
Exhibit 24. Avoidable cost charged to the real property segment
| Cost | Amount | Basis |
|---|---|---|
| Ground rent on the hangar footprint and tenant apron | $89,040 | Ground rent on 62,000 square feet of hangar footprint plus 150,000 square feet of tenant apron, at the contract rate |
| Property taxes on the hangar and apron improvements | $52,300 | The portion of the possessory interest and personal property tax bill attributable to the hangar and apron improvements |
| Management at 4.0 percent of real property revenue | $40,693 | Four percent of real property revenue, the rate a third party manager quoted for the portfolio |
| Staffing a hangar landlord would still carry | $118,000 | One full time facilities and tenant services position, one half of a billing and administrative position, and after hours callout coverage |
| Vehicle and equipment operating attributable to tenants | $8,200 | Tug, sweeper, and snow removal equipment operating cost attributable to tenant service |
| Marketing and administrative attributable to tenants | $5,400 | Listing, signage, and administrative cost attributable to hangar leasing |
| Total avoidable cost | $313,633 |
One line in the overhead schedule is a genuine joint cost rather than an avoidable one. Percentage rent is owed on gross revenue above a fixed $6,500,000 breakpoint. Neither segment crosses that breakpoint standing alone, so neither causes the charge by itself and the avoidable cost test does not resolve it. We charge the whole of it to the service segment, on the ground that a hangar landlord with $1,017,330 of revenue would never trigger it. A reader who prefers to split it should move about $2,348 a year to the real property segment, which moves the segment split by less than a point.
Exhibit 25. Concluded segment earnings
| Real property | Service | Total | |
|---|---|---|---|
| Gross margin | $796,518 | $1,534,416 | $2,330,934 |
| Overhead charged | ($313,633) | ($1,330,715) | ($1,644,348) |
| EBITDA as reported | $482,885 | $203,701 | $686,586 |
| Normalization adjustments | $60,470 | $133,730 | $194,200 |
| Normalized EBITDA | $543,355 | $337,431 | $880,786 |
| Share of normalized EBITDA | 61.7% | 38.3% | 100.0% |
Real property carries 62 percent of the normalized earnings. Section 15 will show that it carries 77 percent of the value, because it does not carry the same risk. That divergence between the earnings split and the value split is the whole reason this section exists.
15. Discount Rates for a Two Part Business
Two segments with different risk get two rates. The real property segment is discounted at a rate built the way a real estate rate is built. The service segment is discounted at a rate built the way a business rate is built. The consolidated rate used in Section 16 is the value weighted blend of the two, not an independent estimate.
Exhibit 26. Real property segment: band of investment
| Component | Weight | Rate | Weighted |
|---|---|---|---|
| Mortgage, 25 year amortization at 7.15 percent | 55% | 8.60% | 4.728% |
| Equity, dividend rate | 45% | 9.50% | 4.275% |
| Band of investment capitalization rate | 100% | 9.00% | |
| Add: long run real property growth | 2.75% | ||
| Real property discount rate | 11.75% |
The mortgage constant is derived from the stated rate and amortization, not assumed. The 55 percent mortgage weight is deliberately below what a fee simple industrial property would carry. The operating agreement gives a leasehold mortgagee a thirty day cure period, which is short, and the remaining term is thirteen years, which puts the collateral inside the window where the reversion extinguishes it before a twenty five year amortization completes. Published guidance in leasehold lending suggests a lease should run at least five years beyond loan maturity, which caps the practical loan term here at roughly eight years and constrains the debt a lender will advance.
Exhibit 27. Service segment: modified capital asset pricing model and weighted average cost of capital
| Component | Rate |
|---|---|
| Risk free rate, twenty year United States Treasury | 4.55% |
| Equity risk premium | 5.00% |
| Size premium, smallest capitalization decile | 5.20% |
| Industry risk adjustment, aviation support services | 0.60% |
| Company specific risk premium | 5.85% |
| Cost of equity | 21.20% |
| Cost of debt, 8.35 percent pre tax, 6.22 percent after tax at a 25.5 percent effective rate | 6.22% |
| Capital structure, 25 percent debt and 75 percent equity | |
| Weighted average cost of capital, service segment | 17.46% |
| Rounded to the nearest quarter point | 17.50% |
What the company specific premium does and does not include
The 5.85 percent company specific premium covers customer concentration in the hangar rent roll, the volatility of fuel margin, key person dependence on the managing member and the director of maintenance, exposure to a single airport, the share of fuel sold through contract programs, and the two unfilled mechanic positions.
One further disclosure belongs here. The 11.75 percent real property rate is built the way real estate rates are built, from a mortgage constant and an equity dividend rate, both of which are pre tax measures. We apply it to after tax cash flow, because the whole of this valuation sits on an after tax invested capital basis and the two components have to be commensurable. The effect is conservative: a pre tax rate applied to after tax cash flow produces a lower value than the reverse, and we would rather disclose the direction than adjust it with a factor we cannot support.
It does not include the risk that the operating agreement ends. That risk is already in the cash flow model, which stops the projection on April 30, 2039 and assigns no terminal value. Charging it again in the discount rate would price the same risk in two places and would understate the business by an amount we have no way to defend. This is the most common technical error we see in FBO valuations and it is worth stating plainly.
Exhibit 28. Consolidated rate, derived from the components
| Segment | Present value | Weight | Rate | Weighted |
|---|---|---|---|---|
| Real property | $2,375,165 | 77.4% | 11.75% | 9.098% |
| Service | $692,212 | 22.6% | 17.50% | 3.949% |
| Blended | $3,067,377 | 100.0% | 13.048% | |
| Rounded, and used in Section 16 | 13.00% |
A weighted average cost of capital built for a small single location operating business is 17.50 percent, which is what Exhibit 27 derived for the service segment. Applying that one rate to every dollar of this company, 62 percent of which is real property earnings, produces $2,566,952. That is 17 percent below the concluded value, and it is the most common way a competent business appraiser gets an FBO wrong. Section 20 shows the arithmetic.
16. Income Approach: Discounted Cash Flow
The projection runs thirteen years, from the effective date to April 30, 2039, and stops. There is no terminal value because there is nothing to sell. Cash flow is debt free, so the result is the value of the invested capital, and it is discounted at the mid year convention because the cash arrives through the year rather than at the end of it.
Exhibit 29. Projection assumptions
| Assumption | Basis |
|---|---|
| Projection period | 13.0 years, matching the remaining term exactly |
| Terminal value | None. Improvements revert without compensation |
| Revenue growth | Line by line. Jet A 2.2 percent, avgas 0.7 percent, Hangar rental 3.0 percent, Tiedown 2.5 percent, Terminal 2.6 percent, Part 145 maintenance 3.4 percent, Flight training 2.0 percent. Blended 2.45 percent |
| Overhead growth | 2.6 percent per year |
| Depreciation and amortization | $311,400 at the effective date, $315,760 in projection year one, growing 1.4 percent per year |
| Maintenance capital expenditure | 2.35 percent of revenue |
| Capital taper, final three years | 1.25 percent of revenue, maintenance only |
| Periodic capital | Scheduled separately below |
| Working capital | 3.90 percent of revenue, charged on the change |
| Effective tax rate | 25.5 percent, federal and state net of the federal benefit |
| Surrender obligation | $340,000 at expiration, deductible, $253,300 after tax |
| Discount rate | 13.00 percent, from Exhibit 28 |
| Discounting convention | Mid year |
Exhibit 30. Periodic capital expenditure schedule
| Projection year | Item | Segment | Amount |
|---|---|---|---|
| 3 | Hangar A door system rebuild | Real property | $265,000 |
| 4 | Ground support equipment replacement cycle | Service | $210,000 |
| 6 | Fuel farm tank replacement and containment upgrade | Service | $520,000 |
| 8 | Terminal and customer area refresh | Real property | $185,000 |
| 9 | Ground support equipment replacement cycle | Service | $210,000 |
| 10 | Apron mill and overlay, 268,100 square feet | Real property | $780,000 |
| Total | $2,170,000 |
The capital taper
Capital expenditure falls to maintenance only in projection years eleven through thirteen and the scheduled items stop. This is not a modeling convenience. A rational operator does not replace a fuel farm or overlay an apron in the last three years of an agreement that returns the improvement to the sponsor for nothing. The behavior is well documented in the specific asset literature and it has two consequences a buyer should see. The first is that cash flow rises in the final years, which flatters the projection. The second is that the premises are handed back in worse condition than they would otherwise be, which is why the surrender obligation is carried as a liability instead of being ignored.
The same logic explains an omission. The Hangar B and Hangar C door systems reach the end of their economic lives inside the term, and the schedule above does not replace them. An operator in year eight of a thirteen year runway repairs a door rather than buying a new one, and the consequence of that choice lands partly in higher maintenance cost and partly in the surrender obligation.
Exhibit 31. Discounted cash flow, thirteen years, no terminal value Illustrative figures for a sample engagement.
| Yr | Revenue | EBITDA | D and A | Taxes | Capital | Working capital | Cash flow | Factor | Present value |
|---|---|---|---|---|---|---|---|---|---|
| 1 | $7,528,222 | $899,863 | $315,760 | ($148,946) | ($176,913) | ($7,028) | $566,975 | 0.9407 | $533,365 |
| 2 | $7,713,191 | $919,435 | $320,180 | ($152,810) | ($181,260) | ($7,214) | $578,151 | 0.8325 | $481,309 |
| 3 | $7,903,050 | $939,516 | $324,663 | ($156,788) | ($450,722) | ($7,404) | $324,603 | 0.7367 | $239,142 |
| 4 | $8,097,934 | $960,120 | $329,208 | ($160,883) | ($400,301) | ($7,600) | $391,336 | 0.6520 | $255,138 |
| 5 | $8,297,983 | $981,260 | $333,817 | ($165,098) | ($195,003) | ($7,802) | $613,358 | 0.5770 | $353,884 |
| 6 | $8,503,342 | $1,002,951 | $338,490 | ($169,437) | ($719,829) | ($8,009) | $105,676 | 0.5106 | $53,957 |
| 7 | $8,714,157 | $1,025,207 | $343,229 | ($173,904) | ($204,783) | ($8,222) | $638,298 | 0.4518 | $288,412 |
| 8 | $8,930,582 | $1,048,044 | $348,034 | ($178,503) | ($394,869) | ($8,441) | $466,233 | 0.3999 | $186,429 |
| 9 | $9,152,773 | $1,071,478 | $352,907 | ($183,236) | ($425,090) | ($8,665) | $454,487 | 0.3539 | $160,825 |
| 10 | $9,380,892 | $1,095,523 | $357,848 | ($188,107) | ($1,000,451) | ($8,897) | ($101,932) | 0.3132 | ($31,920) |
| 11 | $9,615,104 | $1,120,197 | $362,858 | ($193,122) | ($120,189) | ($9,134) | $797,753 | 0.2771 | $221,078 |
| 12 | $9,855,580 | $1,145,517 | $367,938 | ($198,283) | ($123,195) | ($9,379) | $814,661 | 0.2452 | $199,791 |
| 13 | $10,102,496 | $1,171,500 | $373,089 | ($203,595) | ($126,281) | ($9,630) | $831,994 | 0.2170 | $180,568 |
| Present value of cash flow | $3,121,977 | ||||||||
| Less present value of the surrender obligation | ($51,715) | ||||||||
| Indicated value of invested capital | $3,070,262 |
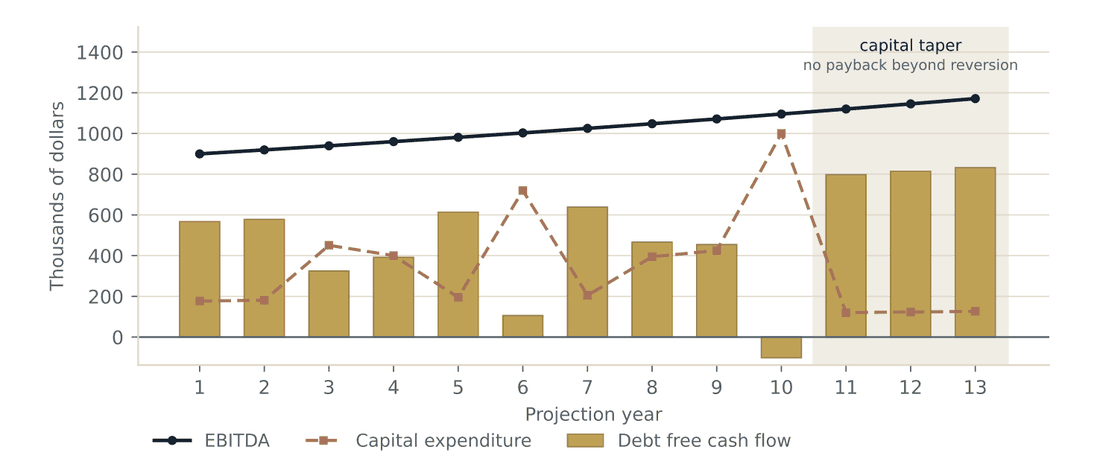
Cash flow dips in year six when the fuel farm comes due and turns negative in year ten, when the apron overlay and the ground support equipment cycle land in the same twelve months. A year of negative free cash flow is not a distress signal here. It is what an operator does in the last year the pavement will pay for itself, and it is followed immediately by the capital taper. Revenue grows at a blended 2.45 percent and EBITDA at 2.22 percent, the gap being overhead escalating faster than the top line. The growth is coming from margin per gallon and hangar rent rather than from volume. The indicated value of the invested capital is $3,070,262, or 3.49 times normalized EBITDA.
17. Sum of the Component Values
The same cash flows, split at the segment line and discounted at their own rates, give a second indication. It is not independent of the first, because Exhibit 28 derived the consolidated rate from these two components. What it is, is a check on the arithmetic and a statement of where the value sits.
Exhibit 33. Real property segment
| Year one | Method | |
|---|---|---|
| Normalized EBITDA, real property segment | $560,330 | Exhibit 25, grown one year |
| Less depreciation and amortization allocated | ($199,150) | Straight line on the leasehold improvements |
| Taxable income | $361,180 | |
| Less income tax at 25.5 percent | ($92,101) | |
| Add back depreciation and amortization | $199,150 | |
| Less capital expenditure | ($97,302) | Real property share of maintenance capital |
| Debt free cash flow, year one | $370,927 | |
| Present value at 11.75 percent over 13 years | $2,434,926 | Mid year convention |
| Less present value of the surrender obligation | ($59,761) | The obligation attaches to the improvements |
| Value of the real property component | $2,375,165 |
Exhibit 34. Service segment
| Year one | Method | |
|---|---|---|
| Normalized EBITDA, service segment | $339,533 | Exhibit 25, grown one year |
| Less depreciation and amortization allocated | ($116,610) | Ground support equipment, vehicles, shop, and systems |
| Taxable income | $222,923 | |
| Less income tax at 25.5 percent | ($56,845) | |
| Add back depreciation and amortization | $116,610 | |
| Less capital expenditure | ($79,611) | Service share of maintenance capital |
| Less increase in working capital | ($7,028) | 3.90 percent of the revenue increase |
| Debt free cash flow, year one | $196,048 | |
| Value of the service component | $692,212 | Present value at 17.50 percent over 13 years |
Exhibit 35. Sum of the components against the consolidated discounted cash flow
| Value | Share of value | Share of EBITDA | Rate | |
|---|---|---|---|---|
| Real property component | $2,375,165 | 77.4% | 61.7% | 11.75 percent |
| Service component | $692,212 | 22.6% | 38.3% | 17.50 percent |
| Sum of the components | $3,067,377 | 100.0% | 100.0% | 13.05 percent |
| Consolidated discounted cash flow, Section 16 | $3,070,262 | 13.00 percent | ||
| Difference | $2,885 | 0.09 above |
The 0.09 percent difference between the two indications is rounding in the consolidated rate. We report the reconciliation rather than suppressing it, and we are explicit that the two are not independent evidence. What the split does establish is the divergence between where the earnings sit and where the value sits: real property produces 62 percent of normalized EBITDA and 77 percent of the value, because it is discounted 575 basis points below the service segment.
The effective yield on the real property component
It is worth converting the real property component into a capitalization rate, because that is the language a real estate reader thinks in. Exhibit 26 built the 11.75 percent discount rate as a 9.00 percent band of investment rate plus 2.75 percent of long run growth, so the perpetuity capitalization rate it implies is that same 9.00 percent. The rate this component actually carries, being year one cash flow divided by the concluded component value, is 15.62 percent. The difference of 662 basis points is the price of the reversion.
Published leasehold capitalization rate ladders put the premium at fifteen years of remaining term somewhere between 120 and 220 basis points. Those ladders describe leaseholds where the improvements still have value at the end. Where the reversion is uncompensated, as here, the premium at thirteen years is 662 basis points. Calling that a refinement understates it. The two treatments sit $4,121,407 and $2,375,165 apart on the same earnings stream.
18. Market Approach and the Term Adjustment
The market approach for fixed base operators has a data problem, and the honest way to use it is to say so first. Transactions are private. The published multiple literature is thin, dated, and written by advisers who were themselves warning readers not to rely on it.
Exhibit 36. Published guidance on fixed base operator multiples
| Source | What it says | How we used it |
|---|---|---|
| Aviation Resource Group International, September 1999 | The typical range of multiples rose from 4.5 to 5.5 in early 1997 to 5.5 to 6.5 in 1999. High end transactions in the period were attributed to strategic, synergistic, and emotional motivations rather than to standard valuation | Establishes that the earnings multiple is the market's language and gives an anchor from a consolidation cycle. Not used as a current range |
| Airport Business Solutions, June 2000 | The earnings before interest, taxes, depreciation, and amortization multiple is the industry standard. Identifies the factors that raise and lower it, and warns about penalties applied to successful operators | Confirms the metric and the direction of the adjustments |
| Aviation Business Strategies Group, March 2011 | Multiples of five, ten, and even fifteen times get quoted. The multiple does not really count in the transaction, and some recent deals have had no multiple at all | A caution, and the reason the market approach carries 25 percent weight rather than more |
| Valuation Takes Flight, published research | Charter and aircraft management operators transact on the order of four to eight times earnings for a general operator and higher for larger or premium operators. Maintenance shops are often benchmarked near one times revenue | Bounds the reasonable range for an aviation services operating business |
Concluding a base multiple
The evidence supports a range of 5.50 to 7.00 times normalized EBITDA for a full service fixed base operator with a long operating agreement, an established fuel book, and enclosed hangar storage. We concluded 6.25 times. That is the multiple for the position a buyer would like the subject to be in. Three adjustments carry it to the position the subject is actually in.
Exhibit 37. Adjustments to the base multiple
| Adjustment | Factor | Support |
|---|---|---|
| Remaining term | 0.72034 | The ratio of the present value annuity factor over 13.0 years to the factor over a perpetual horizon, both at 13.00 percent with 2.45 percent growth. The factor falls out of the two rates and the term |
| Scale | less 12 percent | The guideline evidence is drawn from operators materially larger than the subject. Smaller operators transact at lower multiples for the ordinary reasons: thinner management, less diversified revenue, and a smaller buyer pool |
| Buyer type | less 8 percent | The published transactions include strategic consolidators paying for network effects the subject cannot deliver to a single location buyer. The high end observations in the 1999 source were expressly attributed to strategic motivation |
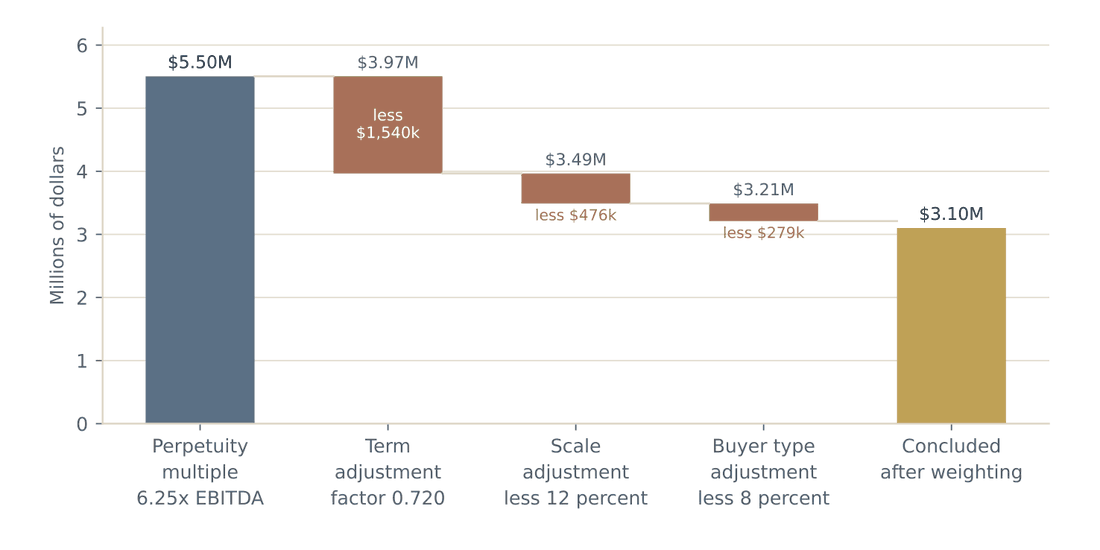
Exhibit 39. Market approach conclusion
| Multiple | Value | |
|---|---|---|
| Base multiple applied to normalized EBITDA of $880,786 | 6.250x | $5,504,911 |
| Term adjustment, factor 0.72034 | 4.502x | $3,965,389 |
| Scale adjustment, less 12 percent | 3.962x | $3,489,542 |
| Buyer type adjustment, less 8 percent | 3.645x | $3,210,379 |
The term adjustment is doing almost all of the work. It removes $1,539,523 from the indication, against $755,010 for the scale and buyer type adjustments combined. Anyone who applies a published FBO multiple to a short agreement without that factor is not making a small error.
19. Replacement Cost, Insurable Value, and the Barrier to Entry
We did not develop a cost approach as a value indication, and the reason is worth stating before the schedule rather than after it. The improvements cost far more than the remaining term allows the operator to recover. Reconciling cost to the income indication would require an external obsolescence deduction of a size we could not extract from any market evidence, and a figure that large cannot be plugged. What the cost schedule is good for is two other things: it sets insurable value, and it measures what a new entrant would have to spend.
Exhibit 40. Replacement cost new and component depreciation Illustrative figures for a sample engagement.
| Component | Replacement cost new | Effective age | Economic life | Accrued depreciation | Depreciated cost |
|---|---|---|---|---|---|
| Hangar A shell, 30,000 square feet at $172.00 | $5,160,000 | 16 yr | 45 yr | 35.6% | $3,325,333 |
| Hangar A door systems, two bays | $780,000 | 17 yr | 25 yr | 68.0% | $249,600 |
| Hangar B shell, 20,000 square feet at $179.00 | $3,580,000 | 16 yr | 45 yr | 35.6% | $2,307,111 |
| Hangar B door systems, two bays | $540,000 | 17 yr | 25 yr | 68.0% | $172,800 |
| Hangar C shell, 12,000 square feet at $186.00 | $2,232,000 | 14 yr | 45 yr | 31.1% | $1,537,600 |
| Hangar C door system, one bay | $336,000 | 15 yr | 25 yr | 60.0% | $134,400 |
| Terminal and customer building, 9,400 square feet at $342.00 | $3,214,800 | 15 yr | 40 yr | 37.5% | $2,009,250 |
| Apron and taxilane, 268,100 square feet at $12.40 | $3,324,440 | 16 yr | 25 yr | 64.0% | $1,196,798 |
| Fuel farm, 52,000 gallons with containment and canopy | $1,485,000 | 10 yr | 30 yr | 33.3% | $990,000 |
| Auto parking, utilities, lighting, fencing, and gates | $612,000 | 16 yr | 20 yr | 80.0% | $122,400 |
| Total | $21,264,240 | 43.4% | $12,045,293 |
Door systems are broken out from the shells they hang on because they depreciate on a different clock. A twenty five year door system inside a forty five year building is the single most expensive mechanical component on the premises and the one most likely to be deferred. Treating the hangar as one depreciable unit understates accrued depreciation and, in an insurance claim, understates what it costs to make the building operable again.
Insurable value
Insurable value excludes the apron, the site improvements, and the below grade portion of the buildings, because none of them is destroyed by the perils a property policy covers. Excluding foundations and excavation at 9 percent of building shell cost gives an insurable value of $16,050,988. That is 75 percent of replacement cost new, and it is the figure the schedule of values should carry.
The barrier to entry
A third operator arriving at Halstead Regional would have to build. Replacement cost new of the subject's improvements is $21,264,240. That entrant would be building on a shorter agreement than the subject signed in 2009, into a two operator market, and against an incumbent whose capital is already sunk. Section 5 established that the sponsor's ability to keep a qualified applicant out is narrow and conditional. This section establishes why one has not appeared anyway.
That barrier is real and it supports the earnings. It does not support a higher multiple, because it protects a stream that ends on the same day regardless. A buyer paying $3,100,000 for $21,264,240 of improvements is not buying the improvements. The buyer is renting them for thirteen years, and the price is what thirteen years of their earnings are worth.
20. Four Ways This Business Gets Valued Wrong
Each of the four methods below is used by somebody in the market on a business like this one. Each is taught somewhere and each produces a defensible answer to a question that is not the question being asked. The errors do not run in the same direction.
Exhibit 41. Four methods, four answers, one subject
| Method | Indication | Difference from the concluded value | Why it fails |
|---|---|---|---|
| Perpetuity multiple, no term adjustment | $5,504,911 | 78 percent above | Applies a going concern multiple drawn from operators with long agreements to earnings that stop in 13 years. |
| Capitalizing the property earnings in perpetuity | $4,813,619 | 55 percent above | Values the hangar and ramp earnings the way a stabilized real estate asset is valued and adds the service component, ignoring that the improvements revert without compensation in 13 years. |
| Single business discount rate applied to every dollar | $2,566,952 | 17 percent below | Charges real property earnings the cost of capital of an operating business, which understates the real property component. |
| Depreciated cost of the improvements | $12,045,293 | 289 percent above | Prices what the improvements cost to build rather than what the remaining term allows the operator to recover. |
| Concluded value, Section 25 | $3,100,000 |
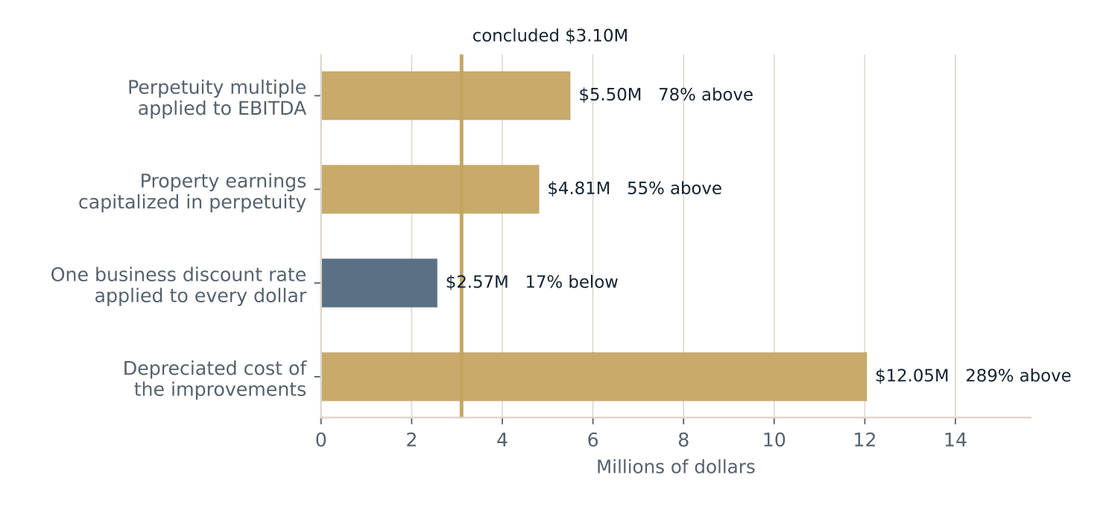
The two errors that point up
Applying a perpetuity multiple to a thirteen year earnings stream overstates the business by 78 percent. That is the error most often made by sellers, and by brokers quoting comparable multiples out of a trade publication. Capitalizing the property earnings in perpetuity overstates it by 55 percent, and that is the error a real estate appraiser makes when handed an FBO income statement: the capitalization rate is built correctly, the growth rate is reasonable, and the answer is still more than half again the concluded value, because a capitalization rate assumes the income continues.
The two errors that point down or sideways
Applying one business discount rate to every dollar understates the business by 17 percent, because 62 percent of the earnings are real property and are being charged the cost of capital of an operating company. That is the error a business appraiser makes when handed a leasehold. Depreciated cost is not an error of direction so much as an error of category: $12,045,293 is what the improvements are worth to someone who will own them for their remaining economic life of 24.7 years, and the operator will own them for thirteen.
The spread between the highest and lowest of these four is $2,566,952 to $12,045,293, on a business worth $3,100,000. Any of them can be produced by a competent professional using a method taught in a textbook. What separates them is not skill. It is whether the method was built for an asset that reverts.
21. Sensitivity
Two variables move this valuation. One of them is the discount rate, which is what most sensitivity sections test. The other is the blended fuel margin per gallon, which matters about 8 times as much and is much easier to get wrong.
Exhibit 43. Indicated value at combinations of discount rate and fuel margin
| Blended fuel margin | 11.50% | 12.25% | 13.00% | 13.75% | 14.50% |
|---|---|---|---|---|---|
| less 35.0 percent | $1,654,517 | $1,602,723 | $1,553,974 | $1,508,044 | $1,464,729 |
| less 17.5 percent | $2,467,423 | $2,387,451 | $2,312,118 | $2,241,086 | $2,174,048 |
| As concluded | $3,280,328 | $3,172,179 | $3,070,262 | $2,974,128 | $2,883,368 |
| plus 17.5 percent | $4,093,234 | $3,956,908 | $3,828,406 | $3,707,170 | $3,592,687 |
| plus 35.0 percent | $4,906,139 | $4,741,636 | $4,586,550 | $4,440,212 | $4,302,006 |
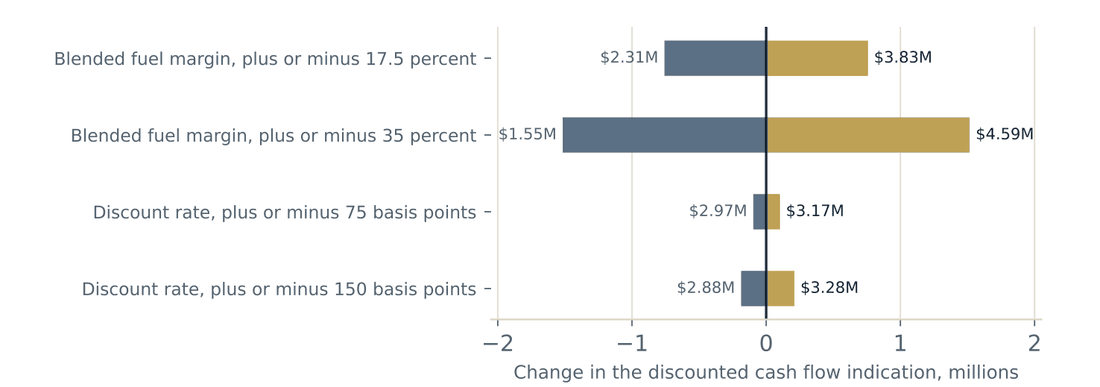
A seventeen and a half percent change in the blended fuel margin is $0.20 per gallon on a $1.143 blended margin. It moves the indication by roughly $758,144 in either direction. A seventy five basis point change in the discount rate moves it by roughly $99,026. The ratio is about 8 to one.
What that ratio means for diligence
It means the hours belong on the fuel data. A buyer who spends three days arguing about whether the discount rate should be 13.00 percent or 13.75 percent, and one afternoon on the fuel system export, has allocated effort exactly backwards. The questions that matter are how much of the book is contract fuel, which direction that share is moving, what the current fuel supply agreement prices at, when it renews, and whether any based operator is close to self fueling.
It also means the seller's presentation should lead with margin per gallon by customer type instead of total gallons. Exhibit 16 is the page a buyer will want first, and most sellers do not produce it.
Sensitivity analysis is usually run to demonstrate that the conclusion is robust. This one demonstrates the opposite, and that is the useful result. The conclusion is robust to the discount rate and fragile to the fuel margin, which tells the reader precisely where to concentrate.
22. Simulating the Renewal Options
The agreement carries two five year renewal options. Neither belongs to the operator. Both are at the sponsor's sole discretion, and the first is conditioned on the operator having invested $1,500,000 during the preceding term. The operator therefore has to spend the money without knowing whether the sponsor will grant. That is not an option in the financial sense and it should not be valued as one.
We simulated it instead. Twenty thousand trials, with the four variables that drive the conclusion drawn from distributions and the renewal decisions drawn as events.
Exhibit 45. Simulation specification
| Variable | Distribution | Basis |
|---|---|---|
| Jet A volume growth | Normal, mean zero, standard deviation 0.90 percent per year | Flat volume as concluded, with the dispersion observed in the trailing 36 months |
| Jet A margin growth | Normal, mean 2.2 percent, standard deviation 1.20 percent per year | The concluded growth rate, with dispersion reflecting supply agreement resets and mix migration |
| Hangar occupancy | Normal, mean 91 percent, standard deviation 3.5 percent, bounded at 78 and 98 percent | The three year average and its variation, bounded by physical capacity and by the waiting list |
| Maintenance growth | Normal, mean 3.4 percent, standard deviation 1.10 percent per year | The concluded rate, with dispersion reflecting technician availability |
| Discount rate | Normal, mean 13.00 percent, standard deviation 90 basis points, bounded 180 basis points below and 300 above | The concluded rate, with dispersion reflecting the buyer pool |
| First renewal granted | Bernoulli, probability 55 percent | Sponsor discretion. Estimated from the sponsor's record on the four aeronautical leases that have reached renewal since 2015 |
| Second renewal granted | Bernoulli, probability 45 percent, conditional on the first | Lower because the term reaches 2049 and the airport layout plan contemplates a west side reconfiguration |
| Ground rent at renewal | Reset to 135 percent of the then current rate | The self sustainability obligation in Section 5 and the market rent gap in Section 23 |
| Capital condition | $1,500,000 spent evenly across projection years eleven, twelve, and thirteen | The condition as written in the agreement |
| Trials | 20,000 | Sufficient for the percentile estimates reported |
Before reading the results, one calibration point. Run with every distribution collapsed to its mean and no renewal granted, the simulation returns $3,177,557 against the discounted cash flow indication of $3,070,262, a difference of 3.49 percent. The gap is the simplified growth structure the simulation uses to stay fast. It is small enough that the distribution below can be read as centered on the same business the rest of this report values.
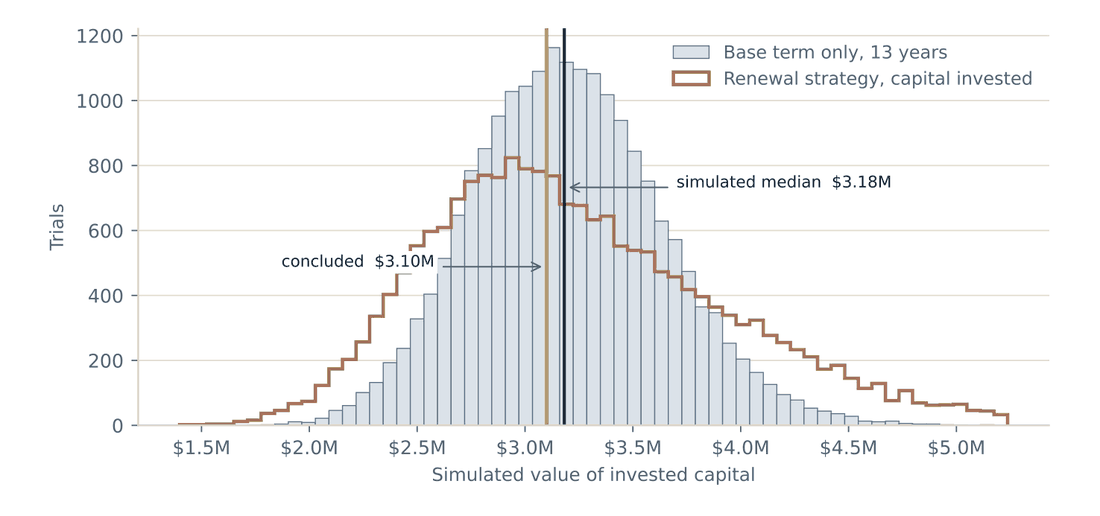
Exhibit 47. Simulation results
| Statistic | Base term only | Renewal strategy |
|---|---|---|
| Mean | $3,198,411 | $3,259,129 |
| Median | $3,182,126 | $3,149,800 |
| Standard deviation | $441,210 | $715,343 |
| Fifth percentile | $2,506,157 | $2,274,350 |
| Twenty fifth percentile | $2,888,286 | $2,745,734 |
| Seventy fifth percentile | $3,484,618 | $3,682,237 |
| Ninety fifth percentile | $3,949,254 | $4,566,769 |
| Concluded value | $3,100,000 | |
| Trials above the concluded value | 57.5 percent |
The simulated median of $3,182,126 sits 2.6 percent above the concluded value of $3,100,000. We did not move the conclusion toward it. A simulation reports the distribution implied by the assumptions fed to it, and its central tendency is not independent evidence about value. What it is useful for is the shape: the fifth to ninety fifth percentile range on the base term runs from $2,506,157 to $3,949,254, which is the range a buyer should expect the answer to land in once the world happens.
Is the renewal worth chasing
This is the question the members asked, and it is the reason the simulation exists. Spending $1,500,000 in the last three years of the term buys a 55 percent chance of five more years and, conditional on that, a 45 percent chance of five more after those. The spend happens whether or not the sponsor grants.
Exhibit 48. The renewal strategy
| Amount | |
|---|---|
| Present value of the capital condition, spent in years eleven through thirteen | ($371,228) |
| Present value of the first option term, five years, if granted | $590,879 |
| Present value of the second option term, five years, if granted | $379,870 |
| Probability the first option is granted | 55 percent |
| Probability both options are granted, as simulated | 24.9 percent |
| Expected value of the option terms, net of the capital condition | $47,773 |
| Value of deferring the surrender obligation beyond 2039 | $12,945 |
| Mean increase in value from the renewal strategy | $60,718 |
| Median increase in value | $66,390 |
| Probability the strategy leaves the members better off | 52.8 percent |
| Renewal probability at which the strategy breaks even | 48.7 percent |
The answer is close to a coin flip, and saying so is more useful than a confident number would be. The strategy adds $60,718 of expected value and leaves the members better off in 52.8 percent of trials. The break even is a 48.7 percent renewal probability, against our 55 percent estimate. The margin is 6.3 points of probability, which is inside the error of any estimate of how a sponsor will behave in 2039.
Exhibit 49. Sensitivity of the renewal strategy to the ground rent reset
| Ground rent at renewal | Multiple of the then current rate | Expected value of the strategy |
|---|---|---|
| $233,463 | 1.00 | $93,528 |
| $268,482 | 1.15 | $73,919 |
| $315,175 | 1.35 | $47,773 |
| $361,867 | 1.55 | $21,627 |
| $408,560 | 1.75 | ($4,518) |
The strategy survives a reset of half again on the ground rent and turns negative somewhere short of a seventy five percent reset. That is worth knowing, because the sponsor sets the renewal rate and the self sustainability obligation in Section 5 points it upward. It is still not the main risk. The main risk is the sponsor saying no, which costs the whole $371,228.
The practical recommendation follows from the break even, not from the mean. Before committing $1,500,000, the members should seek a written expression of the sponsor's renewal criteria. Moving the probability from 55 percent to 75 percent moves the expected value from roughly break even to clearly positive.
23. Allocation of the Concluded Value
A buyer and a seller both need the concluded value broken into the pieces a purchase agreement and a tax return will require. The pieces also test the conclusion, because the sum of what the business owns should bear some relationship to what the business is worth.
Exhibit 50. Net working capital
| Component | Amount |
|---|---|
| Accounts receivable | $412,000 |
| Fuel and parts inventory | $168,300 |
| Prepaid expenses and deposits | $46,100 |
| Accounts payable and accrued liabilities | ($340,000) |
| Net working capital | $286,400 |
Exhibit 51. The favorable ground rent
| Amount | |
|---|---|
| Concluded market ground rent, $0.51 per square foot | $200,634 |
| Contract ground rent, $0.42 per square foot | ($165,228) |
| Annual advantage | $35,406 |
| Present value over 13.0 years at 11.75 percent, escalating at 2.5 percent | $258,280 |
Market ground rent of $0.51 per square foot was concluded from the sponsor's published rates and charges schedule for new aeronautical leases, from two leases executed on the field since 2023, and from a survey of eight comparable general aviation airports in the region. The subject's rate was set in 2009 and has escalated only by the capped consumer price index adjustment, which is why the gap exists.
Exhibit 52. Allocation of the concluded value
| Component | Amount | Basis | Asset class |
|---|---|---|---|
| Net working capital | $286,400 | Exhibit 50, at carrying value | III and IV |
| Tangible personal property | $901,000 | Exhibit 10, fair value in continued use | V |
| Leasehold improvements, contributory value | $2,116,885 | Real property component value from Exhibit 33, less the favorable ground rent | V |
| Favorable ground rent | $258,280 | Exhibit 51 | VI |
| Sum of the identified components | $3,562,565 | ||
| Concluded value of invested capital | $3,100,000 | ||
| Residual to other intangibles and goodwill | ($462,565) | The residual is negative | VI and VII |
There is no goodwill in this business
The identified components sum to $3,562,565 against a concluded value of $3,100,000. The residual is negative $462,565, which is 14.9 percent of the value. Under the residual method, consideration is allocated in class order and each class receives fair market value but no more than the consideration remaining. Here the consideration runs out inside Class V. The favorable ground rent, being a Class VI intangible, receives nothing, Class VII goodwill receives nothing, and the Class V assets are allocated proportionately rather than at full fair value.
Exhibit 53. Class V allocated proportionately
| Class | Asset | Fair value | Allocation factor | Allocated |
|---|---|---|---|---|
| III and IV | Cash, receivables, inventory, and prepaid, net of payables | $286,400 | 1.0000 | $286,400 |
| V | Tangible personal property | $901,000 | 0.9323 | $840,010 |
| V | Leasehold improvements | $2,116,885 | 0.9323 | $1,973,590 |
| VI | Favorable ground rent and other intangibles | $258,280 | 0.0000 | $0 |
| VII | Goodwill | None identified | $0 | |
| Total consideration allocated | $3,562,565 | $3,100,000 |
This is not a criticism of the operation. It is a description of what happens to a capital intensive business as its agreement runs down. The improvements on this leasehold carry a depreciated cost of $12,045,293 and the equipment a fair value of $901,000. Thirteen years of earnings support $2,813,600 of that between them. The gap is the quasi rent the operator committed to this site and cannot now move, and it is recoverable only by extending the term, which is what Section 22 prices.
A buyer should read the negative residual as information rather than as a warning. It says the purchase price is supported entirely by hard assets and a below market ground lease, with nothing paid for reputation, customer lists, or the assembled workforce. That is a defensible place to be, and it is the opposite of what the perpetuity multiple in Section 20 would have the buyer paying for.
24. The Sponsor's Side of the Agreement
Every leasehold has two sides. The operator holds thirteen years of earnings. The sponsor holds thirteen years of rent and fees, and then it holds the buildings. We quantify the sponsor's position because a valuation that reports only one side of an agreement has not described the agreement.
Exhibit 54. Present value of the sponsor's position
| Yr | Ground rent | Fuel flowage | Percentage rent | Total | Factor | Present value |
|---|---|---|---|---|---|---|
| 1 | $169,359 | $97,005 | $20,564 | $286,928 | 0.9656 | $277,060 |
| 2 | $173,593 | $96,852 | $24,264 | $294,708 | 0.9003 | $265,336 |
| 3 | $177,932 | $96,701 | $28,061 | $302,694 | 0.8395 | $254,104 |
| 4 | $182,381 | $96,552 | $31,959 | $310,892 | 0.7827 | $243,343 |
| 5 | $186,940 | $96,406 | $35,960 | $319,306 | 0.7298 | $233,034 |
| 6 | $191,614 | $96,262 | $40,067 | $327,943 | 0.6805 | $223,158 |
| 7 | $196,404 | $96,120 | $44,283 | $336,807 | 0.6345 | $213,697 |
| 8 | $201,314 | $95,980 | $48,612 | $345,906 | 0.5916 | $204,634 |
| 9 | $206,347 | $95,842 | $53,055 | $355,245 | 0.5516 | $195,953 |
| 10 | $211,506 | $95,707 | $57,618 | $364,830 | 0.5143 | $187,636 |
| 11 | $216,793 | $95,573 | $62,302 | $374,669 | 0.4795 | $179,670 |
| 12 | $222,213 | $95,442 | $67,112 | $384,767 | 0.4471 | $172,040 |
| 13 | $227,769 | $95,312 | $72,050 | $395,131 | 0.4169 | $164,731 |
| Present value of rent and fees | $2,814,395 |
Exhibit 55. The reversion
| Amount | |
|---|---|
| Real property segment earnings in the year after expiration | $835,240 |
| Weighted remaining economic life of the improvements at expiration | 14.9 years |
| Value of the improvements at April 30, 2039, at 11.75 percent with 2.75 percent growth | $6,613,962 |
| Discounted thirteen years at 7.25 percent | $2,662,544 |
Two conventions in that schedule run against the sponsor and are worth naming. The Hangar A door rebuild in projection year three and the apron overlay in projection year ten both reset the economic life of the component they touch, and we credited both. The fuel farm tank replacement in projection year six is a partial replacement of a larger asset and we credited none of it, which understates what reverts. Neither convention changes the direction of the conclusion below.
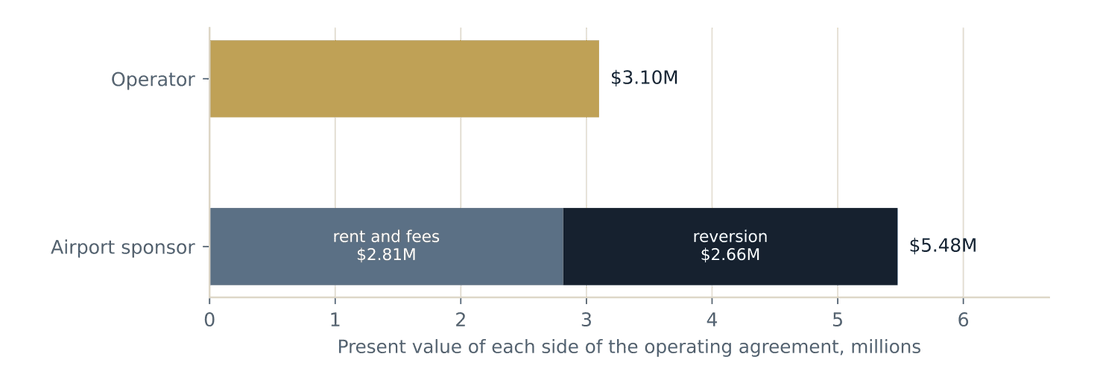
Exhibit 57. Summary of both sides
| Position | Present value | Share of the total | Rate |
|---|---|---|---|
| Operator, invested capital | $3,100,000 | 36.1% | 13.00 percent |
| Sponsor, rent and fees | $2,814,395 | 32.8% | 7.25 percent |
| Sponsor, reversion of the improvements | $2,662,544 | 31.0% | 7.25 percent |
| Total value in the agreement | $8,576,939 | 100.0% |
The sponsor's position is worth $5,476,939, or 1.77 times the operator's. That is not a criticism of the sponsor, which has a statutory obligation to make the airport self sustaining and a fiduciary duty to the public that owns it. It is a statement about where the value in a maturing ground leasehold sits, and it becomes more lopsided every year the term runs down.
The economics literature calls the operator's exposure an appropriable quasi rent: the return on capital that is worth more where it sits than anywhere else, and that the counterparty can therefore claim at renewal. Seventeen years into a thirty year agreement, with $21,264,240 of improvements bolted to somebody else's land, the subject has close to the textbook exposure. That is not a defect in the deal. It is what a ground lease is.
25. Reconciliation and Value Conclusion
Three indications, developed from the same normalized earnings and the same thirteen year horizon, differ by 4.7 percent from lowest to highest.
Exhibit 58. Reconciliation
| Approach | Indication | Weight | Weighted | What it is best at | Where it is weak |
|---|---|---|---|---|---|
| Discounted cash flow | $3,070,262 | 50% | $1,535,131 | Models the finite term directly and prices the periodic capital and the surrender obligation | Depends on a discount rate that cannot be observed |
| Sum of the components | $3,067,377 | 25% | $766,844 | Prices the two halves of the business at their own risk and shows where the value sits | Not independent of the discounted cash flow, and depends on the overhead allocation |
| Guideline transactions | $3,210,379 | 25% | $802,595 | Anchored to what buyers have actually paid, adjusted arithmetically for the term | The published evidence is thin, dated, and drawn from a consolidation cycle |
| Weighted indication | 100% | $3,104,570 |
Weighting
The discounted cash flow carries half the weight because it is the only approach that models the actual shape of this business: a stream that ends on a known date, with two capital events inside it and an obligation at the end. The sum of the components and the guideline transactions each carry a quarter. The sum of the components earns its weight by testing the risk split rather than the total, and the guideline approach earns its weight by tying the answer to transaction evidence, but neither deserves more than that: the first is not independent, and the second rests on published sources that are old enough to have described a different market.
Rounding
The weighted indication is $3,104,570. We rounded to $3,100,000, a movement of 0.15 percent below. A conclusion carried to the dollar implies a precision the inputs do not support.
Exhibit 59. The conclusion tested against every metric in this report
| Metric | Value | Comment |
|---|---|---|
| Multiple of normalized EBITDA | 3.52x | Against a 6.25x base multiple for a long agreement, adjusted by the term factor of 0.720 |
| Per gallon of annual uplift | $4.47 | On 694,000 gallons of Jet A and avgas combined |
| Multiple of revenue | 0.42x | Consistent with an operation whose revenue is mostly cost of fuel |
| Percentile of the simulated distribution | 43 percent | The conclusion sits below the simulated median, which is expected given the simplifications described in Section 22 |
| Against the liquidation floor | 5.21x | The going concern premium over an orderly liquidation |
| Against replacement cost new | 14.6 percent | The buyer pays a fraction of what the improvements cost, because the buyer holds them for thirteen years |
| Against the sponsor's position | 0.57x | The sponsor holds the larger side of this agreement |
26. Exposure Time, Marketing Time, and the Level of Value
Exposure time
Reasonable exposure time is 9 to 18 months. That is longer than a comparable operating business of the same size would require, and the reason is the term. A buyer must underwrite the remaining thirteen years, obtain the sponsor's consent, arrange financing against collateral that extinguishes inside a normal amortization, and satisfy itself on the environmental condition of a fuel farm. Each of those adds weeks. The pool of buyers who will do all four is smaller than the pool who would look at the business.
Marketing time
Prospective marketing time is 12 to 18 months at the concluded value. Shorter periods are achievable at a discount, and the two most common paths to a faster close are a sale to the competing operator on the field and a sale to a regional consolidator already holding sponsor relationships. Both of those buyers underwrite the term faster because they have done it before, and both will price the term more aggressively for the same reason.
The level of value
This opinion is stated on a controlling, marketable basis. A minority interest in the same company is worth materially less per unit, and the members should understand the arithmetic before any internal transfer is priced off this report.
Exhibit 60. What changes for a minority interest
| Adjustment | Direction | Support |
|---|---|---|
| Discount for lack of control | Reduces value | Derived from observed control premiums rather than asserted. A median control premium of 34.4 percent implies a minority discount of 25.6 percent. Financial control premiums rather than strategic control premiums are the correct input, because a strategic premium reflects synergy a minority holder was never going to receive |
| Discount for lack of marketability | Reduces value | Restricted stock studies observe discounts in roughly the twenty to thirty five percent range, with the older studies clustering near the top of that range and studies after the 1997 holding period change clustering near the bottom. Pre initial public offering studies observe thirty to sixty percent. The applicable figure is selected on the Mandelbaum factors, not from the midpoint of a range |
| The operating agreement between the members | Increases the marketability discount | Transfer restrictions, a holding period running to a triggering event, and a redemption formula all reduce the ability of a minority holder to convert the interest to cash |
| Order of application | Multiplicative | The discounts compound rather than add. A twenty percent control discount and a thirty percent marketability discount produce a forty four percent reduction, not fifty |
We have not applied either discount, because the interest valued is one hundred percent. The table is here so that nobody reads this report, divides by the membership units, and prices a minority transfer off the quotient.
27. What Buy Side Diligence Will Test
This section is written for the members, not for a buyer. Every item below is something a competent buyer will ask about, and a seller who has the answer ready spends less of the negotiation reconstructing it.
Exhibit 61. Diligence checklist, in the order we would work it
| No. | Item | What the buyer is testing | Value at stake |
|---|---|---|---|
| 1 | Fuel margin by customer type, 36 months | Whether the blended margin is stable or is migrating toward contract programs | $411,598 on a ten point migration |
| 2 | Self fueling intentions of the largest based turbine operators | Whether a right the sponsor cannot restrict is about to be exercised | $421,053 if the three largest self fuel |
| 3 | Fuel supply agreement: term, volume commitment, pricing mechanism, and renewal | Whether the into plane cost in the model survives the transaction | Every cent per gallon is $6,940 a year |
| 4 | Sponsor's written renewal criteria and its record on prior renewals | Whether the renewal probability is nearer 49 percent or nearer 75 percent | $60,718 of expected value, and the whole capital condition |
| 5 | Hangar rent roll with expirations and any rate concessions | Whether $717,030 of gross margin is contracted or is month to month | The real property component, $2,375,165 |
| 6 | Phase I environmental site assessment with a foam specific scope | Fuel farm releases and per and polyfluoroalkyl substances in the Hangar A suppression system | Unquantified. This is the item that stops transactions |
| 7 | Deferred maintenance survey and the surrender obligation | What the premises will cost to hand back in 2039, and what is deferred now | $340,000 modeled, and the condition of the apron |
| 8 | Minimum standards, current and any amendments under consideration | Whether compliance cost is about to rise, and whether the renewal condition tightens | Cost of compliance, and the renewal option itself |
| 9 | Sponsor consent process and any conditions attached to prior consents | Whether the transfer closes and on what terms | The transaction |
| 10 | Part 145 certificate status, ratings, and the two open technician positions | Whether $490,380 of gross margin transfers with the business | $490,380 a year, and the growth rate assumed |
| 11 | Insurance: current limits, the sponsor's required limits, and loss runs | Whether the premium normalization in Section 13 is sufficient | The normalization, and any uninsured exposure |
| 12 | Rates and charges history and the sponsor's capital improvement program | Whether ground rent, flowage, or percentage rent is about to move | Ground rent of $165,228 and flowage of $97,160 |
The list is ordered by how much of the answer is genuinely unknown when the buyer sits down, not by the dollars at stake. Item five is the largest single figure on it and also the easiest of the twelve to settle: a rent roll either shows contracted terms or it does not. The first four cannot be settled from a document at all, and Section 21 showed that the first three of them move the answer further than anything else in the model.
28. Certification
We certify that, to the best of our knowledge and belief:
- The statements of fact in this report are true and correct.
- The reported analyses, opinions, and conclusions are limited only by the reported assumptions and limiting conditions and are our impartial and unbiased professional analyses, opinions, and conclusions.
- We have no present or prospective interest in the business or the property and no personal interest with respect to the parties involved.
- We have performed no services regarding the subject business within the three year period immediately preceding acceptance of this assignment.
- We have no bias with respect to the business or to the parties involved.
- Our engagement was not contingent upon developing or reporting predetermined results.
- Our compensation is not contingent upon the development or reporting of a predetermined value, the amount of the value opinion, the attainment of a stipulated result, or the occurrence of a subsequent event directly related to the intended use of this assignment.
- We made a personal inspection of the premises and the equipment.
- No one provided significant assistance to the persons signing this certification.
Signature omitted. This is a sample report and is not certified.
Dr. Carter, DBA, CFA, FRM, CAIA, CIPM · Valuation Takes Flight LLC
29. About Valuation Takes Flight
Valuation Takes Flight LLC is an aeronautical valuation advisory firm. We value aircraft hangars, fixed base operations, and airport ground leases, and we do it nationwide. The practice is remote first, with site work performed wherever the engagement calls for it.
What we do
Market value and market rent opinions on hangars and FBO facilities. Business valuations of fixed base operators, repair stations, charter and management companies, and flight schools. Ground lease and reversion analysis. Hangar rent studies for owners and airport sponsors. Property tax appeal support. Partner and shareholder buyout valuations. Employee stock ownership plan valuations. Estate and gift valuations of aviation holding entities. Litigation support and expert testimony. Portfolio level review for lenders and institutional owners.
Who leads the work
Dr. Carter, DBA, CFA, FRM, CAIA, CIPM, is the founder and principal. He is the author of Valuing Aircraft Hangars: A Textbook for Real Estate Appraisers and serves as Assistant Professor at an aeronautical university in Daytona Beach, Florida. His research covers hangar valuation method, ground lease economics, capitalization rate determination for aviation leaseholds, and the valuation of aviation service businesses. Before founding the firm he worked in institutional investment analysis, performance measurement under the Global Investment Performance Standards, and risk modeling for private assets.
How we scope an engagement
Every proposal states the scope, the intended use and users, the deliverable, and the delivery date before work begins. Where an intended use requires a state certified general appraiser, we say so at the proposal stage and structure the engagement accordingly. We would rather turn down work than deliver a report that will not do the job the client needs it to do.
If you are holding this because you are choosing an adviser, the useful comparison between proposals is scope to scope rather than price to price. Ask which of the exhibits in this report the other proposal includes, and ask who builds the model.
Valuation Takes Flight LLC · valuationtakesflight.com · Valuationtakesflight@outlook.com · 314-277-6572
30. Addendum: Terms Used in This Report
| Term | As used here |
|---|---|
| Appropriable quasi rent | The return on capital worth more where it sits than in its next best use. It is what a counterparty can claim at renewal without the operator walking away. |
| Avoidable cost | The cost that would disappear if a segment ceased to exist. The basis on which overhead is charged to segments in this report. |
| Blended margin per gallon | Total fuel gross margin divided by total gallons, after the flowage fee. The figure that matters, as distinct from the posted retail price. |
| Contract fuel | Fuel sold through a third party program at a negotiated price. It moves volume and compresses margin. |
| Exclusive right | A power or privilege excluding another from exercising a like right. Prohibited at an obligated airport, and capable of arising from unreasonable standards as well as from an express agreement. |
| Fuel flowage fee | A per gallon charge payable to the sponsor on all fuel delivered to the airport, including fuel a self fueler brings in. A variable cost of selling fuel. |
| Going concern value | The value of a business as an operating whole, including working capital, tangible property, and intangible assets. |
| Invested capital | The sum of interest bearing debt and equity. The basis on which this opinion is stated, because capital structure is a financing choice rather than an attribute of the business. |
| Into plane cost | The delivered cost of fuel in the tank, including transportation and any additive, before the flowage fee. |
| Minimum standards | The sponsor's published requirements for conducting a commercial aeronautical activity. They must be reasonable, attainable, uniformly applied, and relevant to the activity. |
| Normalized EBITDA | Reported earnings before interest, taxes, depreciation, and amortization, restated to remove owner discretionary and nonrecurring items in both directions. |
| Obligated airport | An airport whose sponsor has accepted federal grants or federally conveyed property and is subject to grant assurances. |
| Reversion | The passing of improvements to the sponsor at expiration. Where the agreement provides no compensation, the operator's terminal value is zero. |
| Self fueling | An aircraft owner fueling its own aircraft with its own employees and equipment. A right under Grant Assurance 22(f). It cannot be contracted out to a third party. |
| Self sustainability | The federal requirement that a sponsor maintain a fee and rental structure making the airport as self sustaining as possible in its circumstances. |
| Surrender obligation | The cost of returning the premises in the condition the agreement requires. A liability at expiration, not a neutral event. |
| Term factor | The ratio of the present value annuity factor over the remaining term to the factor over a perpetual horizon. Converts a perpetuity multiple into a finite term multiple. |
| Transferability haircut | A reduction to the intangible component of value reflecting that certificates and personal relationships do not transfer with the business. |
31. Addendum: Index of Exhibits
This report is a sample prepared by Valuation Takes Flight LLC to show the format, method, and level of support our clients receive. Halstead Regional Airport, Halstead Jet Center, the named parties, and all market and financial data in it are illustrative. It is not an opinion of value for any real business and should not be relied upon for any transaction, filing, or proceeding.